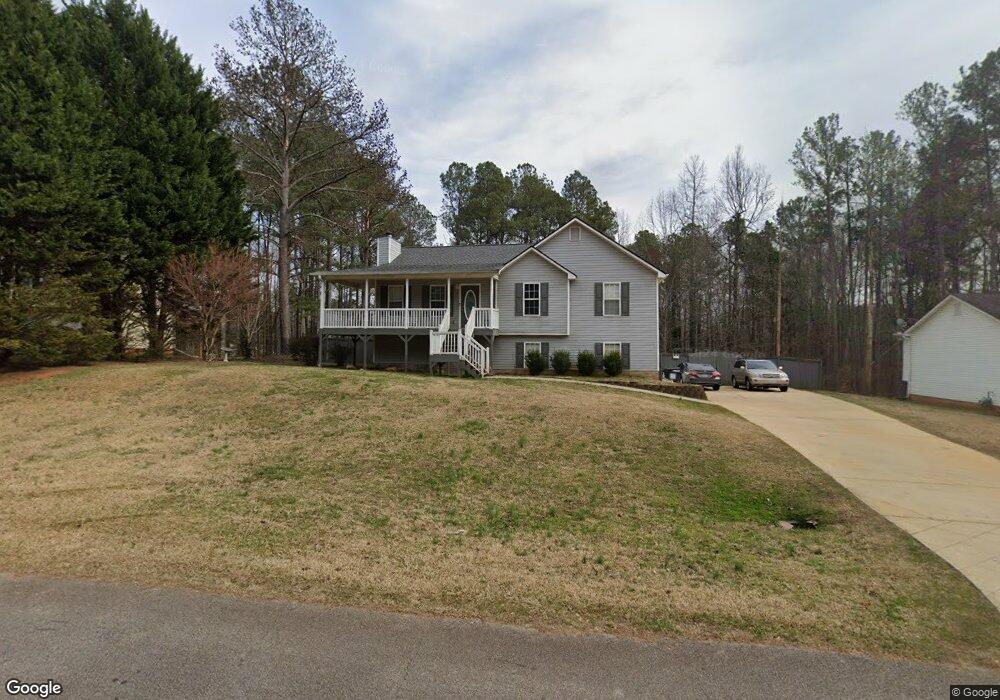
112 Yellow Pine Dr Temple, GA 30179
Estimated Value: $288,881 - $300,000
4
Beds
2
Baths
1,943
Sq Ft
$151/Sq Ft
Est. Value
About This Home
This home is located at 112 Yellow Pine Dr, Temple, GA 30179 and is currently estimated at $292,720, approximately $150 per square foot. 112 Yellow Pine Dr is a home located in Carroll County with nearby schools including Temple Elementary School, Temple Middle School, and Temple High School.
Ownership History
Date
Name
Owned For
Owner Type
Purchase Details
Closed on
Jan 29, 2024
Sold by
Larrieu Eric M
Bought by
Nguyen Steven
Current Estimated Value
Home Financials for this Owner
Home Financials are based on the most recent Mortgage that was taken out on this home.
Original Mortgage
$150,000
Outstanding Balance
$146,905
Interest Rate
6.61%
Mortgage Type
New Conventional
Estimated Equity
$145,815
Purchase Details
Closed on
Sep 15, 2017
Sold by
Shockley Realty & Dev Inc
Bought by
Larrieu Eric M
Home Financials for this Owner
Home Financials are based on the most recent Mortgage that was taken out on this home.
Original Mortgage
$137,260
Interest Rate
4.5%
Mortgage Type
FHA
Purchase Details
Closed on
Apr 4, 2017
Sold by
Thomas Lenny L
Bought by
Shockley Realty & Development
Purchase Details
Closed on
Mar 30, 2001
Sold by
Freedom Land Company
Bought by
Thomas Lenny L
Purchase Details
Closed on
Oct 1, 2000
Bought by
Freedom Land Company
Create a Home Valuation Report for This Property
The Home Valuation Report is an in-depth analysis detailing your home's value as well as a comparison with similar homes in the area
Home Values in the Area
Average Home Value in this Area
Purchase History
We collect this data history from publicly available records. To have your information removed, we recommend requesting removal directly through your county’s website.
| Date | Buyer | Sale Price | Title Company |
|---|---|---|---|
| Nguyen Steven | -- | -- | |
| Larrieu Eric M | $142,000 | -- | |
| Shockley Realty & Development | $85,200 | -- | |
| Thomas Lenny L | $103,900 | -- | |
| Freedom Land Company | -- | -- |
Source: Public Records
Mortgage History
We collect this data history from publicly available records. To have your information removed, we recommend requesting removal directly through your county’s website.
| Date | Status | Borrower | Loan Amount |
|---|---|---|---|
| Open | Nguyen Steven | $150,000 | |
| Previous Owner | Larrieu Eric M | $137,260 |
Source: Public Records
Tax History
| Year | Tax Paid | Tax Assessment Tax Assessment Total Assessment is a certain percentage of the fair market value that is determined by local assessors to be the total taxable value of land and additions on the property. | Land | Improvement |
|---|---|---|---|---|
| 2025 | $2,705 | $120,906 | $8,000 | $112,906 |
| 2024 | $2,862 | $133,739 | $8,000 | $125,739 |
| 2023 | $2,966 | $122,274 | $8,000 | $114,274 |
| 2022 | $2,503 | $99,812 | $8,000 | $91,812 |
| 2021 | $1,826 | $71,244 | $8,000 | $63,244 |
| 2020 | $1,635 | $63,698 | $8,000 | $55,698 |
| 2019 | $1,555 | $60,104 | $8,000 | $52,104 |
| 2018 | $1,237 | $47,124 | $4,000 | $43,124 |
| 2017 | $1,058 | $40,179 | $4,000 | $36,179 |
| 2016 | $1,059 | $40,179 | $4,000 | $36,179 |
| 2015 | $1,114 | $39,832 | $8,000 | $31,832 |
| 2014 | $1,119 | $39,832 | $8,000 | $31,832 |
Source: Public Records
Map
Nearby Homes
- 706 Bar J Rd
- 0 Lakeridge Dr Unit 10762260
- 196 Lakeridge Dr
- 0 Bar J Rd Unit 10578558
- 0 Bar J Rd Unit 7627694
- 566 Clinton Dr
- 211 White Pine Ln
- 316 Lakeridge Dr
- 848 Windy Mill Ct
- 108 Villa Rosa Ridge
- 195 River Oak Ct
- 110 Kathy Ln
- 87 Wildwood Dr
- 94 Villa Rosa Way
- 262 N Loblolly Crossing
- 20 Kathy Ln
- 1005 Creek Run Place
- 145 Gentle Breeze Ct
- 384 Double d Rd
- 167 Edgewater Dr
- 106 Yellow Pine Dr
- 118 Yellow Pine Dr
- 113 Water Oak Ct
- 119 Water Oak Ct
- 100 Yellow Pine Dr
- 115 Yellow Pine Dr
- 109 Yellow Pine Dr
- 107 Water Oak Ct
- 124 Yellow Pine Dr
- 103 Yellow Pine Dr
- 121 Yellow Pine Dr
- 125 Water Oak Ct
- 101 Water Oak Ct
- 23 S Red Oak Way
- 127 Yellow Pine Dr
- 60 S Red Oak Way
- 122 Water Oak Ct
- 104 Water Oak Ct
- 128 Lakeridge Dr
- 106 Lakeridge Dr
Your Personal Tour Guide
Ask me questions while you tour the home.