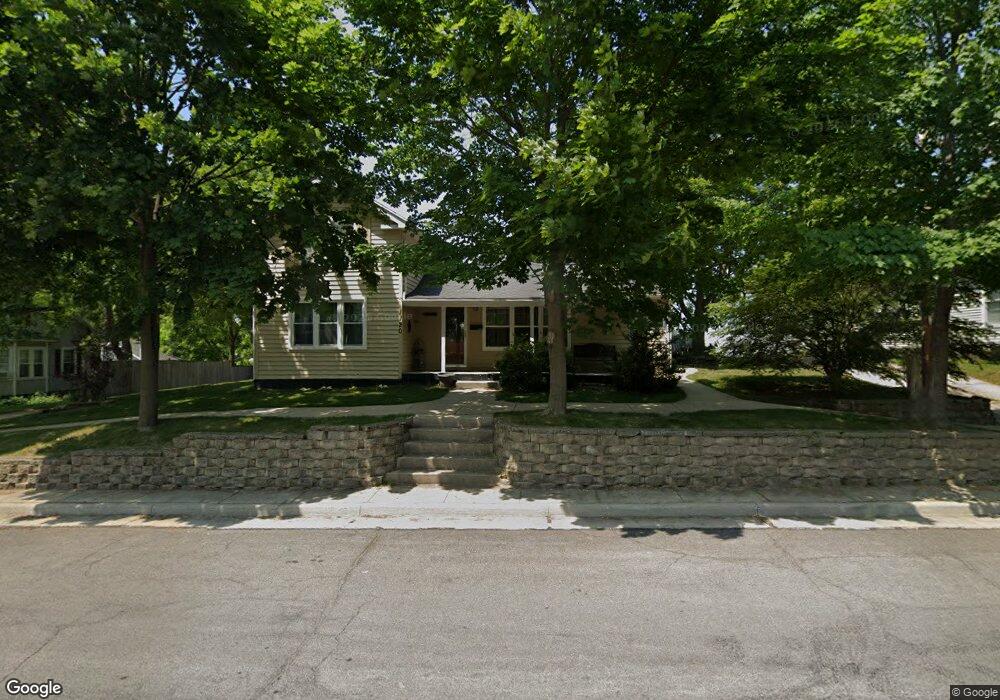
1120 11th Ave Union Grove, WI 53182
Estimated Value: $244,771 - $282,000
3
Beds
1
Bath
1,355
Sq Ft
$196/Sq Ft
Est. Value
About This Home
This home is located at 1120 11th Ave, Union Grove, WI 53182 and is currently estimated at $265,443, approximately $195 per square foot. 1120 11th Ave is a home located in Racine County with nearby schools including Union Grove Elementary School, Union Grove High School, and Union Grove Christian School.
Ownership History
Date
Name
Owned For
Owner Type
Purchase Details
Closed on
Jun 10, 2021
Sold by
Heineck John J and Heineck Margaret M
Bought by
John And Margaret Heineck Family Trust
Current Estimated Value
Purchase Details
Closed on
Feb 8, 2007
Sold by
Deridder John P and Deridder Karen E
Bought by
Heineck John J and Heineck Margaret M
Home Financials for this Owner
Home Financials are based on the most recent Mortgage that was taken out on this home.
Original Mortgage
$170,000
Interest Rate
6.23%
Mortgage Type
New Conventional
Purchase Details
Closed on
Nov 14, 2005
Sold by
Swaaitz William E and Swaaitz Sandra J
Bought by
Deridder John P and Deridder Karen E
Home Financials for this Owner
Home Financials are based on the most recent Mortgage that was taken out on this home.
Original Mortgage
$35,600
Interest Rate
5.68%
Mortgage Type
Stand Alone Second
Create a Home Valuation Report for This Property
The Home Valuation Report is an in-depth analysis detailing your home's value as well as a comparison with similar homes in the area
Home Values in the Area
Average Home Value in this Area
Purchase History
| Date | Buyer | Sale Price | Title Company |
|---|---|---|---|
| John And Margaret Heineck Family Trust | -- | None Available | |
| Heineck John J | $170,000 | -- | |
| Deridder John P | $178,000 | -- |
Source: Public Records
Mortgage History
| Date | Status | Borrower | Loan Amount |
|---|---|---|---|
| Previous Owner | Heineck John J | $170,000 | |
| Previous Owner | Deridder John P | $35,600 | |
| Previous Owner | Deridder John P | $142,400 |
Source: Public Records
Tax History Compared to Growth
Tax History
| Year | Tax Paid | Tax Assessment Tax Assessment Total Assessment is a certain percentage of the fair market value that is determined by local assessors to be the total taxable value of land and additions on the property. | Land | Improvement |
|---|---|---|---|---|
| 2024 | $2,164 | $143,600 | $32,700 | $110,900 |
| 2023 | $2,126 | $143,600 | $32,700 | $110,900 |
| 2022 | $2,249 | $143,600 | $32,700 | $110,900 |
| 2021 | $2,097 | $143,600 | $32,700 | $110,900 |
| 2020 | $2,393 | $127,100 | $24,000 | $103,100 |
| 2019 | $2,427 | $127,100 | $24,000 | $103,100 |
| 2018 | $2,349 | $127,600 | $24,000 | $103,600 |
| 2017 | $2,547 | $127,600 | $25,300 | $102,300 |
| 2016 | $2,541 | $127,600 | $25,300 | $102,300 |
| 2015 | $2,717 | $127,600 | $25,300 | $102,300 |
| 2014 | $2,670 | $127,600 | $25,300 | $102,300 |
| 2013 | $2,788 | $127,600 | $25,300 | $102,300 |
Source: Public Records
Map
Nearby Homes