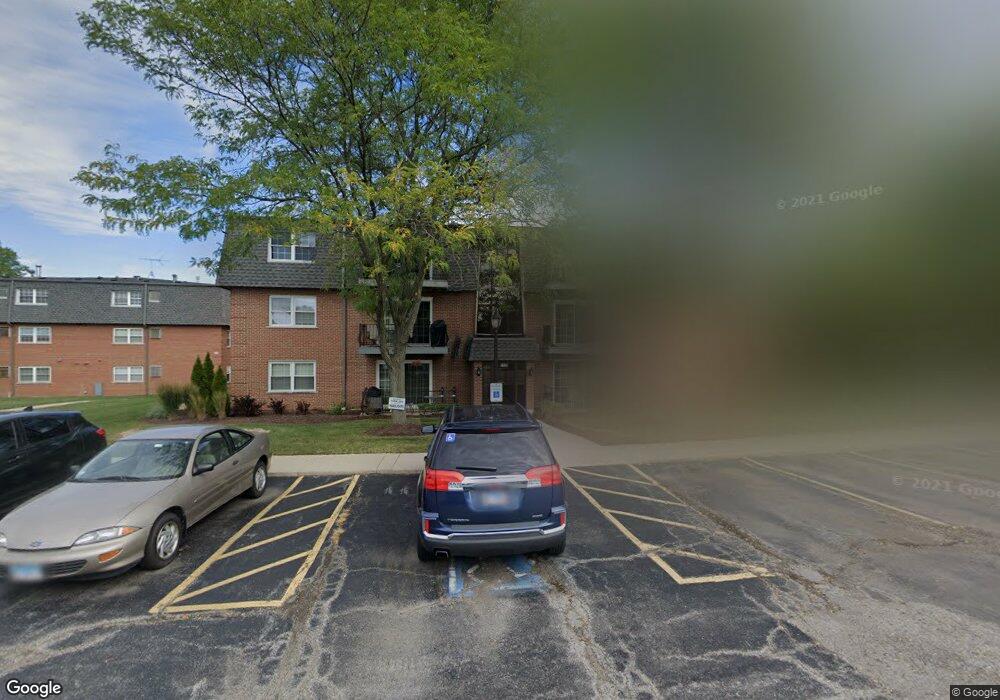
1120 64th St Unit 11203 La Grange Highlands, IL 60525
Estimated Value: $188,832 - $209,000
2
Beds
1
Bath
41,140
Sq Ft
$5/Sq Ft
Est. Value
About This Home
This home is located at 1120 64th St Unit 11203, La Grange Highlands, IL 60525 and is currently estimated at $199,708, approximately $4 per square foot. 1120 64th St Unit 11203 is a home located in Cook County with nearby schools including Highlands Elementary School, Highlands Middle School, and Lyons Township High School.
Ownership History
Date
Name
Owned For
Owner Type
Purchase Details
Closed on
Apr 20, 2021
Sold by
Mol Joseh C and The Joseph C Mol Trust
Bought by
Gacov Toni
Current Estimated Value
Home Financials for this Owner
Home Financials are based on the most recent Mortgage that was taken out on this home.
Original Mortgage
$121,500
Interest Rate
2.62%
Mortgage Type
New Conventional
Purchase Details
Closed on
Dec 21, 2017
Sold by
Mol Rosanna
Bought by
Mol Joseph C and Joseph C Mol Trust
Purchase Details
Closed on
Jul 19, 2008
Sold by
Mol Rosanna
Bought by
Mol Rosanna and Rosanna Mol Trust
Purchase Details
Closed on
Jun 12, 1997
Sold by
Riordan Kevin M and Riordan Yvonne
Bought by
Moi Joseph and Moi Rosanna
Purchase Details
Closed on
Sep 9, 1993
Sold by
State Bank Of Countryside
Bought by
Riordan Kevin M and Riordan Yvonne
Home Financials for this Owner
Home Financials are based on the most recent Mortgage that was taken out on this home.
Original Mortgage
$63,900
Interest Rate
7.24%
Create a Home Valuation Report for This Property
The Home Valuation Report is an in-depth analysis detailing your home's value as well as a comparison with similar homes in the area
Home Values in the Area
Average Home Value in this Area
Purchase History
| Date | Buyer | Sale Price | Title Company |
|---|---|---|---|
| Gacov Toni | $135,000 | Fidelity National Title | |
| Mol Joseph C | -- | Attorney | |
| Mol Rosanna | -- | None Available | |
| Moi Joseph | $92,000 | -- | |
| Riordan Kevin M | $53,333 | -- |
Source: Public Records
Mortgage History
| Date | Status | Borrower | Loan Amount |
|---|---|---|---|
| Previous Owner | Gacov Toni | $121,500 | |
| Previous Owner | Riordan Kevin M | $63,900 |
Source: Public Records
Tax History Compared to Growth
Tax History
| Year | Tax Paid | Tax Assessment Tax Assessment Total Assessment is a certain percentage of the fair market value that is determined by local assessors to be the total taxable value of land and additions on the property. | Land | Improvement |
|---|---|---|---|---|
| 2024 | $2,827 | $13,415 | $1,557 | $11,858 |
| 2023 | $1,979 | $13,415 | $1,557 | $11,858 |
| 2022 | $1,979 | $7,921 | $1,692 | $6,229 |
| 2021 | $441 | $7,920 | $1,692 | $6,228 |
| 2020 | $441 | $7,920 | $1,692 | $6,228 |
| 2019 | $441 | $9,678 | $1,556 | $8,122 |
| 2018 | $0 | $9,678 | $1,556 | $8,122 |
| 2017 | $243 | $9,678 | $1,556 | $8,122 |
| 2016 | $441 | $10,250 | $1,353 | $8,897 |
| 2015 | $456 | $10,250 | $1,353 | $8,897 |
| 2014 | $441 | $10,250 | $1,353 | $8,897 |
| 2013 | $438 | $9,427 | $1,353 | $8,074 |
Source: Public Records
Map
Nearby Homes
- 1140 64th St Unit 6
- 6220 Sunset Ave
- 94 Hawthorne Dr
- 7445 Willow Springs Rd
- 6630 S Brainard Ave Unit PT203
- 6670 S Brainard Ave Unit 402
- 6660 S Brainard Ave Unit 103
- 164 Cascade Dr
- 170 Cascade Dr
- 6700 S Brainard Ave Unit 428
- 191 Cascade Dr
- 10725 Forestview Rd
- 6262 Edgebrook Ln E
- 127 Acacia Cir Unit 505
- 6814 Joliet Rd Unit 9
- 111 Acacia Dr Unit 508
- 6213 Edgebrook Ln W
- 1901 W Plainfield Rd
- 6818 Joliet Rd Unit 9
- 7001 Sunset Ave
- 1120 64th St Unit 8
- 1120 64th St Unit 112010
- 1120 64th St Unit 11205
- 1120 64th St Unit 11206
- 1120 64th St Unit 11207
- 1120 64th St Unit 11204
- 1120 64th St Unit 112012
- 1120 64th St Unit 112011
- 1120 64th St Unit 11202
- 1120 64th St Unit 11209
- 1120 64th St Unit 11201
- 1120 64th St Unit 11208
- 1120 64th St Unit 6
- 1120 64th St Unit 1
- 1120 64th St Unit 2
- 1120 64th St Unit 4
- 1120 64th St Unit 12
- 1120 64th St Unit 3
- 1120 64th St Unit 5
- 1110 64th St Unit 11107