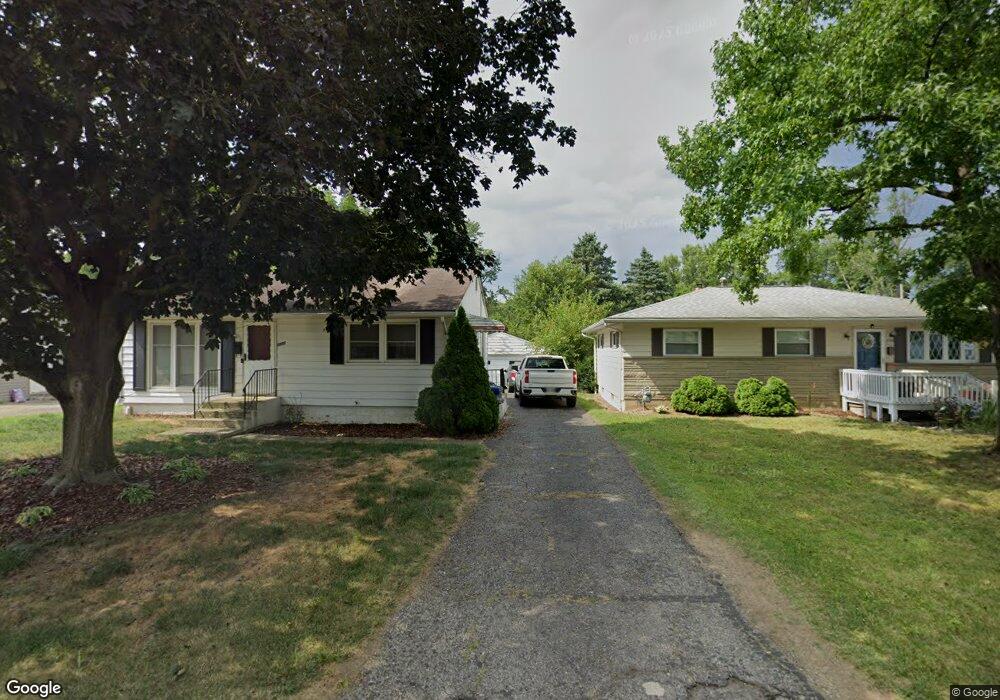
1120 Acton Rd Columbus, OH 43224
North Linden NeighborhoodEstimated Value: $151,000 - $200,000
2
Beds
1
Bath
768
Sq Ft
$235/Sq Ft
Est. Value
About This Home
This home is located at 1120 Acton Rd, Columbus, OH 43224 and is currently estimated at $180,136, approximately $234 per square foot. 1120 Acton Rd is a home located in Franklin County with nearby schools including Maize Road Elementary School, Medina Middle School, and Mifflin High School.
Ownership History
Date
Name
Owned For
Owner Type
Purchase Details
Closed on
Jun 13, 2012
Sold by
Radcliff Roger L and Radcliff Roger
Bought by
Radcliff Roger A
Current Estimated Value
Purchase Details
Closed on
May 5, 2011
Sold by
Federal Home Loan Mortgage Corporation
Bought by
Radcliff Roger
Purchase Details
Closed on
Mar 17, 2011
Sold by
Dyer Ford Leah
Bought by
Federal Home Loan Mortgage Corp
Purchase Details
Closed on
Apr 30, 2008
Sold by
George Harry K and Brewer George Donna Rae
Bought by
Dhayer Jeanne M
Home Financials for this Owner
Home Financials are based on the most recent Mortgage that was taken out on this home.
Original Mortgage
$55,505
Interest Rate
5.93%
Mortgage Type
Purchase Money Mortgage
Purchase Details
Closed on
Mar 8, 2000
Sold by
George Hilma L
Bought by
George Hilma L and George Harry K
Purchase Details
Closed on
Feb 24, 1984
Bought by
George Hilma L
Create a Home Valuation Report for This Property
The Home Valuation Report is an in-depth analysis detailing your home's value as well as a comparison with similar homes in the area
Home Values in the Area
Average Home Value in this Area
Purchase History
| Date | Buyer | Sale Price | Title Company |
|---|---|---|---|
| Radcliff Roger A | $24,000 | None Available | |
| Radcliff Roger | $22,000 | Independent | |
| Federal Home Loan Mortgage Corp | $56,000 | None Available | |
| Dhayer Jeanne M | $65,300 | Chicago Tit | |
| George Hilma L | -- | -- | |
| George Hilma L | -- | -- |
Source: Public Records
Mortgage History
| Date | Status | Borrower | Loan Amount |
|---|---|---|---|
| Previous Owner | Dhayer Jeanne M | $55,505 |
Source: Public Records
Tax History Compared to Growth
Tax History
| Year | Tax Paid | Tax Assessment Tax Assessment Total Assessment is a certain percentage of the fair market value that is determined by local assessors to be the total taxable value of land and additions on the property. | Land | Improvement |
|---|---|---|---|---|
| 2024 | $3,865 | $54,850 | $16,560 | $38,290 |
| 2023 | $2,482 | $54,845 | $16,555 | $38,290 |
| 2022 | $2,415 | $30,280 | $7,950 | $22,330 |
| 2021 | $1,612 | $30,280 | $7,950 | $22,330 |
| 2020 | $1,614 | $30,280 | $7,950 | $22,330 |
| 2019 | $1,467 | $23,590 | $6,370 | $17,220 |
| 2018 | $1,348 | $23,590 | $6,370 | $17,220 |
| 2017 | $1,467 | $23,590 | $6,370 | $17,220 |
| 2016 | $1,353 | $19,920 | $5,460 | $14,460 |
| 2015 | $1,232 | $19,920 | $5,460 | $14,460 |
| 2014 | $1,235 | $19,920 | $5,460 | $14,460 |
| 2013 | $641 | $20,965 | $5,740 | $15,225 |
Source: Public Records
Map
Nearby Homes
- 1090 Pauline Ave
- 1283 Pauline Ave
- 3480 Maize Rd
- 1279 Carolyn Ave
- 3808 Maize Rd
- 1120 Piedmont Rd
- 1126 Piedmont Rd
- 1258 Urana Ave
- 924 Northridge Rd
- 886 Carolyn Ave
- 1270 Urana Ave
- 876 Lenore Ave
- 3724 Eisenhower Rd
- 1382 Elmore Ave
- 3401 Walmar Dr
- 3519 Gerbert Rd
- 3585 Gerbert Rd
- 3352 Karl Rd
- 995 Overbrook Service Dr
- 3268 McGuffey Rd
- 1114 Acton Rd
- 1126 Acton Rd
- 1108 Acton Rd
- 1132 Acton Rd
- 1138 Acton Rd
- 1094 Acton Rd
- 1144 Acton Rd
- 1131 Northridge Rd
- 1123 Northridge Rd
- 1141 Northridge Rd
- 1117 Northridge Rd
- 1119 Acton Rd
- 1088 Acton Rd
- 1150 Acton Rd
- 1111 Acton Rd
- 1147 Northridge Rd
- 1105 Acton Rd
- 1129 Acton Rd
- 1137 Acton Rd
- 1153 Northridge Rd