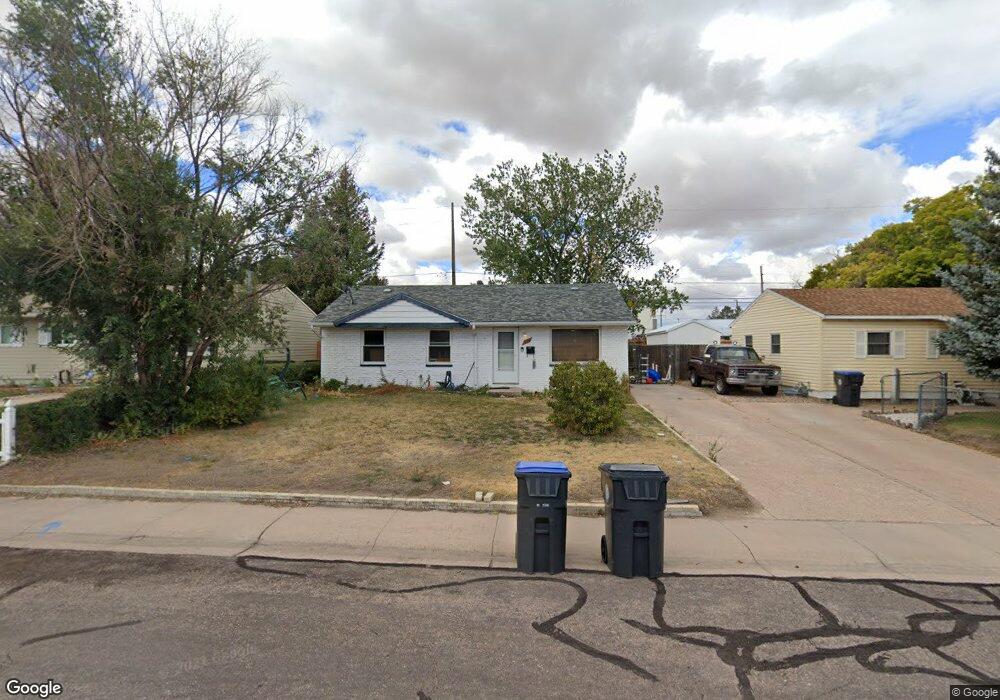
1120 Arp Ave Cheyenne, WY 82007
Estimated Value: $250,000 - $264,000
--
Bed
--
Bath
925
Sq Ft
$276/Sq Ft
Est. Value
About This Home
This home is located at 1120 Arp Ave, Cheyenne, WY 82007 and is currently estimated at $255,040, approximately $275 per square foot. 1120 Arp Ave is a home located in Laramie County with nearby schools including Goins Elementary School, Johnson Junior High School, and South High School.
Ownership History
Date
Name
Owned For
Owner Type
Purchase Details
Closed on
Dec 4, 2023
Sold by
Webster Ronald W
Bought by
Zalcman Aaron
Current Estimated Value
Home Financials for this Owner
Home Financials are based on the most recent Mortgage that was taken out on this home.
Original Mortgage
$221,807
Outstanding Balance
$217,442
Interest Rate
6.6%
Mortgage Type
FHA
Estimated Equity
$37,598
Purchase Details
Closed on
Nov 25, 2003
Sold by
Pauley John Frederick
Bought by
Webster Ronald W
Home Financials for this Owner
Home Financials are based on the most recent Mortgage that was taken out on this home.
Original Mortgage
$65,000
Interest Rate
6.06%
Mortgage Type
FHA
Purchase Details
Closed on
Dec 3, 2001
Sold by
White John E
Bought by
Pauly John Frederick
Home Financials for this Owner
Home Financials are based on the most recent Mortgage that was taken out on this home.
Original Mortgage
$65,964
Interest Rate
6.39%
Mortgage Type
FHA
Create a Home Valuation Report for This Property
The Home Valuation Report is an in-depth analysis detailing your home's value as well as a comparison with similar homes in the area
Home Values in the Area
Average Home Value in this Area
Purchase History
| Date | Buyer | Sale Price | Title Company |
|---|---|---|---|
| Zalcman Aaron | -- | Flying S Title & Escrow | |
| Webster Ronald W | -- | -- | |
| Pauly John Frederick | -- | -- |
Source: Public Records
Mortgage History
| Date | Status | Borrower | Loan Amount |
|---|---|---|---|
| Open | Zalcman Aaron | $221,807 | |
| Closed | Zalcman Aaron | $8,117 | |
| Previous Owner | Webster Ronald W | $65,000 | |
| Previous Owner | Pauly John Frederick | $65,964 |
Source: Public Records
Tax History Compared to Growth
Tax History
| Year | Tax Paid | Tax Assessment Tax Assessment Total Assessment is a certain percentage of the fair market value that is determined by local assessors to be the total taxable value of land and additions on the property. | Land | Improvement |
|---|---|---|---|---|
| 2025 | $1,258 | $12,829 | $2,341 | $10,488 |
| 2024 | $1,258 | $17,795 | $3,121 | $14,674 |
| 2023 | $1,188 | $16,799 | $3,121 | $13,678 |
| 2022 | $1,092 | $15,128 | $3,121 | $12,007 |
| 2021 | $945 | $13,068 | $3,121 | $9,947 |
| 2020 | $894 | $12,387 | $3,121 | $9,266 |
| 2019 | $881 | $12,208 | $3,121 | $9,087 |
| 2018 | $737 | $10,306 | $2,366 | $7,940 |
| 2017 | $709 | $9,826 | $2,366 | $7,460 |
| 2016 | $668 | $9,257 | $2,310 | $6,947 |
| 2015 | $629 | $8,702 | $2,310 | $6,392 |
| 2014 | $619 | $8,522 | $2,310 | $6,212 |
Source: Public Records
Map
Nearby Homes
- TBD Wyott Dr
- 1309 Ahrens Ave
- 1717 W Allison Rd
- 1504 Woodward Dr
- 125 King Ct
- 227 Hynds Ave
- 205 Mccomb Ave
- 1600 Trail Way Rd
- 257 Mccomb Ave
- 240 Patton Ave
- 302 Abby Rd
- 1800 Richard Martin Dr
- 1804 Richard Martin Dr
- 1808 Richard Martin Dr
- 1812 Richard Martin Dr
- 1712 Richard Martin Dr
- 1724 Richard Martin Dr
- 1615 Alyssaelaine Dr
- 1532 Richard Martin Dr
- TBD Snyder Ave