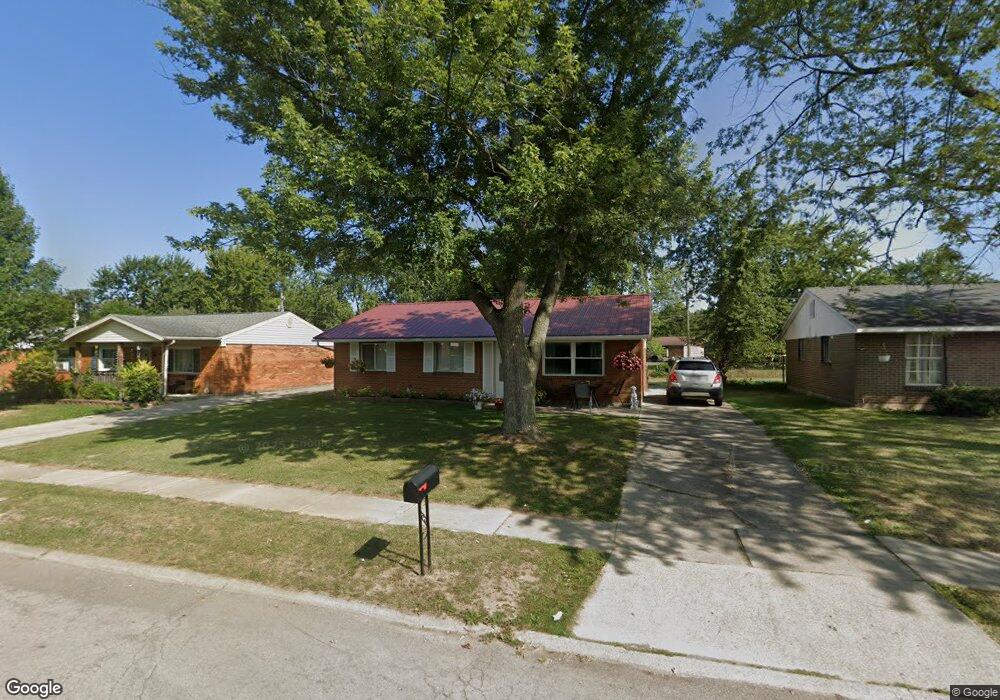
1120 Bahama Dr Lima, OH 45801
Northside Lima NeighborhoodEstimated Value: $128,000 - $145,000
3
Beds
1
Bath
1,026
Sq Ft
$131/Sq Ft
Est. Value
About This Home
This home is located at 1120 Bahama Dr, Lima, OH 45801 and is currently estimated at $134,851, approximately $131 per square foot. 1120 Bahama Dr is a home located in Allen County with nearby schools including Elida Elementary School, Elida Middle School, and Elida High School.
Ownership History
Date
Name
Owned For
Owner Type
Purchase Details
Closed on
May 13, 2011
Sold by
Pocza Martha
Bought by
Stephens Investment Properties Llc
Current Estimated Value
Home Financials for this Owner
Home Financials are based on the most recent Mortgage that was taken out on this home.
Original Mortgage
$42,000
Outstanding Balance
$29,188
Interest Rate
4.88%
Mortgage Type
Future Advance Clause Open End Mortgage
Estimated Equity
$105,663
Purchase Details
Closed on
Sep 21, 1995
Sold by
Lewis R E
Bought by
Pocza Steve and Pocza Martha
Purchase Details
Closed on
Oct 11, 1994
Sold by
Conrad Brian
Bought by
Diane Lewis R and Diane Lewis R
Home Financials for this Owner
Home Financials are based on the most recent Mortgage that was taken out on this home.
Original Mortgage
$33,900
Interest Rate
8.64%
Mortgage Type
New Conventional
Purchase Details
Closed on
Apr 28, 1987
Bought by
Conrad Brian L
Create a Home Valuation Report for This Property
The Home Valuation Report is an in-depth analysis detailing your home's value as well as a comparison with similar homes in the area
Home Values in the Area
Average Home Value in this Area
Purchase History
| Date | Buyer | Sale Price | Title Company |
|---|---|---|---|
| Stephens Investment Properties Llc | $35,500 | Attorney | |
| Pocza Steve | $40,000 | -- | |
| Diane Lewis R | $33,900 | -- | |
| Conrad Brian L | $33,500 | -- |
Source: Public Records
Mortgage History
| Date | Status | Borrower | Loan Amount |
|---|---|---|---|
| Open | Stephens Investment Properties Llc | $42,000 | |
| Previous Owner | Diane Lewis R | $33,900 |
Source: Public Records
Tax History Compared to Growth
Tax History
| Year | Tax Paid | Tax Assessment Tax Assessment Total Assessment is a certain percentage of the fair market value that is determined by local assessors to be the total taxable value of land and additions on the property. | Land | Improvement |
|---|---|---|---|---|
| 2024 | $1,296 | $30,880 | $5,290 | $25,590 |
| 2023 | $1,006 | $21,280 | $3,640 | $17,640 |
| 2022 | $1,019 | $21,280 | $3,640 | $17,640 |
| 2021 | $1,024 | $21,280 | $3,640 | $17,640 |
| 2020 | $1,001 | $19,610 | $3,470 | $16,140 |
| 2019 | $1,001 | $19,610 | $3,470 | $16,140 |
| 2018 | $1,013 | $19,610 | $3,470 | $16,140 |
| 2017 | $958 | $19,610 | $3,470 | $16,140 |
| 2016 | $957 | $19,610 | $3,470 | $16,140 |
| 2015 | $995 | $19,610 | $3,470 | $16,140 |
| 2014 | $995 | $19,780 | $3,470 | $16,310 |
| 2013 | $967 | $19,780 | $3,470 | $16,310 |
Source: Public Records
Map
Nearby Homes
- 0 Sherman Ave
- 849 Runyan Ave
- 765 W O'Connor Ave
- 1580 W Robb Ave
- 700 Lewis Blvd
- 610 W Robb Ave
- 1710 Camp Ave
- 1776 Virginia Ave
- 2104 Virginia Ave
- 608 W O'Connor Ave
- 1116 Belvidere Ave
- 765 Ewing Ave
- 676 Cortlandt Ave
- 2371 Mandolin Dr
- 340 W Robb Ave
- 400 W Northern Ave
- 2129 Reinell Ave
- 607 W Grand Ave
- 1744 Homeward Ave
- 00 Homeward Ave