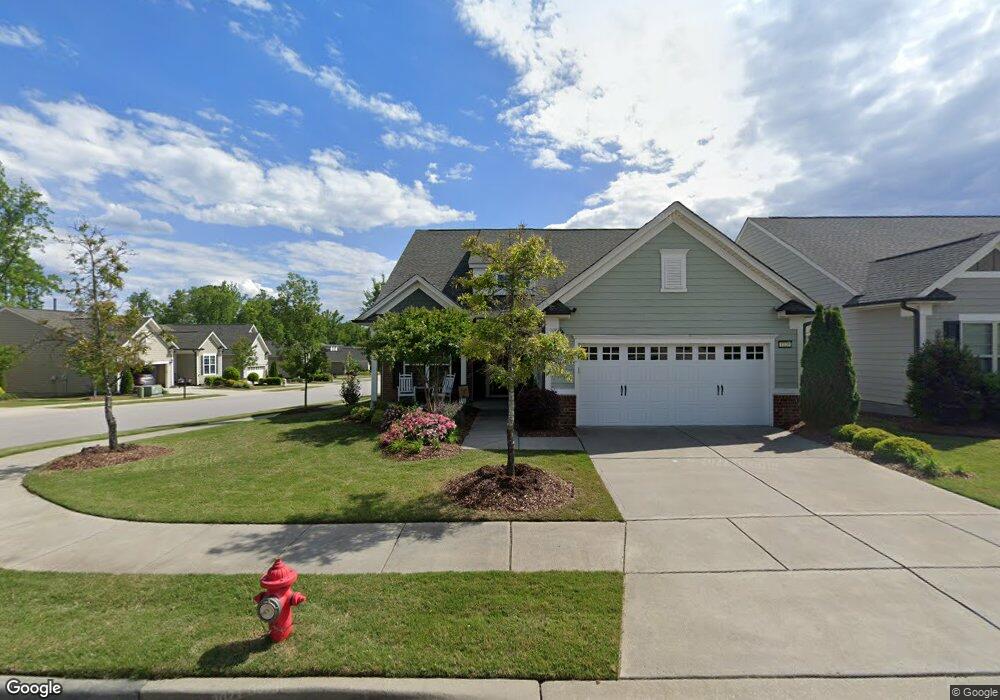
1120 Belvins Trace Dr Durham, NC 27703
Eastern Durham NeighborhoodEstimated Value: $674,689 - $844,000
3
Beds
3
Baths
2,568
Sq Ft
$285/Sq Ft
Est. Value
About This Home
This home is located at 1120 Belvins Trace Dr, Durham, NC 27703 and is currently estimated at $730,922, approximately $284 per square foot. 1120 Belvins Trace Dr is a home located in Durham County with nearby schools including Spring Valley Elementary School, John W Neal Middle School, and Southern School of Energy & Sustainability.
Ownership History
Date
Name
Owned For
Owner Type
Purchase Details
Closed on
May 29, 2024
Sold by
Nidetz Jeffrey Scott and Nidetz Cindy Ann
Bought by
Nidetz Trust and Nidetz
Current Estimated Value
Purchase Details
Closed on
Jul 19, 2017
Sold by
Logue Joseph B and Logue Daphne
Bought by
Nidetz Jeffrey and Nidetz Cindy
Purchase Details
Closed on
Apr 27, 2017
Sold by
Sally M Williams
Bought by
Logue Joseph and Logue Daphne
Home Financials for this Owner
Home Financials are based on the most recent Mortgage that was taken out on this home.
Original Mortgage
$89,917
Interest Rate
4.03%
Purchase Details
Closed on
Feb 20, 2015
Sold by
Pulte Home Corp
Bought by
Logue Joseph B and Logue Daphne M
Home Financials for this Owner
Home Financials are based on the most recent Mortgage that was taken out on this home.
Original Mortgage
$219,420
Interest Rate
3.74%
Mortgage Type
New Conventional
Create a Home Valuation Report for This Property
The Home Valuation Report is an in-depth analysis detailing your home's value as well as a comparison with similar homes in the area
Home Values in the Area
Average Home Value in this Area
Purchase History
| Date | Buyer | Sale Price | Title Company |
|---|---|---|---|
| Nidetz Trust | -- | None Listed On Document | |
| Nidetz Jeffrey | $425,000 | None Available | |
| Logue Joseph | -- | -- | |
| Logue Joseph B | $410,500 | None Available |
Source: Public Records
Mortgage History
| Date | Status | Borrower | Loan Amount |
|---|---|---|---|
| Previous Owner | Logue Joseph | $89,917 | |
| Previous Owner | Logue Joseph | -- | |
| Previous Owner | Logue Joseph B | $219,420 |
Source: Public Records
Tax History
| Year | Tax Paid | Tax Assessment Tax Assessment Total Assessment is a certain percentage of the fair market value that is determined by local assessors to be the total taxable value of land and additions on the property. | Land | Improvement |
|---|---|---|---|---|
| 2025 | $3,954 | $664,835 | $134,520 | $530,315 |
| 2024 | $5,819 | $417,165 | $82,500 | $334,665 |
| 2023 | $5,464 | $417,165 | $82,500 | $334,665 |
| 2022 | $5,339 | $417,165 | $82,500 | $334,665 |
| 2021 | $5,314 | $417,165 | $82,500 | $334,665 |
| 2020 | $5,189 | $417,165 | $82,500 | $334,665 |
| 2019 | $5,189 | $417,165 | $82,500 | $334,665 |
| 2018 | $5,587 | $411,866 | $77,000 | $334,866 |
| 2017 | $5,546 | $411,866 | $77,000 | $334,866 |
| 2016 | $5,359 | $473,003 | $77,000 | $396,003 |
| 2015 | $1,066 | $77,000 | $77,000 | $0 |
Source: Public Records
Map
Nearby Homes
- 1117 Hooper Place
- 1212 Lincoln Mill Dr
- 1111 Clay Hill Way
- 1508 Bloomsbury Manor Dr
- 1609 Horne Creek Dr
- 1108 Hines Forest Dr
- 1114 Hines Forest Dr
- 1211 Gardengate Dr
- 1412 Palmer Hill Dr
- 104 Burlington Mill Ct
- 2030 Oakdale Dr
- 2106 Oakdale Dr
- 2028 Oakdale Dr
- 2032 Oakdale Dr
- 514 Turnstone Dr
- 2018 Oakdale Dr
- 6218 Old Tavern Dr
- 3029 Glen Lyon Dr
- 501 Sunset Lake Dr
- 2020 Oakdale Dr
- 1118 Belvins Trace Dr
- 1116 Belvins Trace Dr
- 1408 Horne Creek Dr
- 1406 Horne Creek Dr
- 1317 Lincoln Mill Dr
- 1410 Horne Creek Dr Unit Lot 336
- 1410 Horne Creek Dr
- 1315 Lincoln Mill Dr
- 1119 Belvins Trace Dr
- 1404 Horne Creek Dr Unit Lot# 333
- 1404 Horne Creek Dr
- 1121 Belvins Trace Dr
- 1412 Horne Creek Dr
- 1117 Belvins Trace Dr
- 1313 Lincoln Mill Dr
- 1110 Belvins Trace Dr
- 1402 Horne Creek Dr
- 1115 Belvins Trace Dr
- 1311 Lincoln Mill Dr
- 1111 Belvins Trace Dr
Your Personal Tour Guide
Ask me questions while you tour the home.