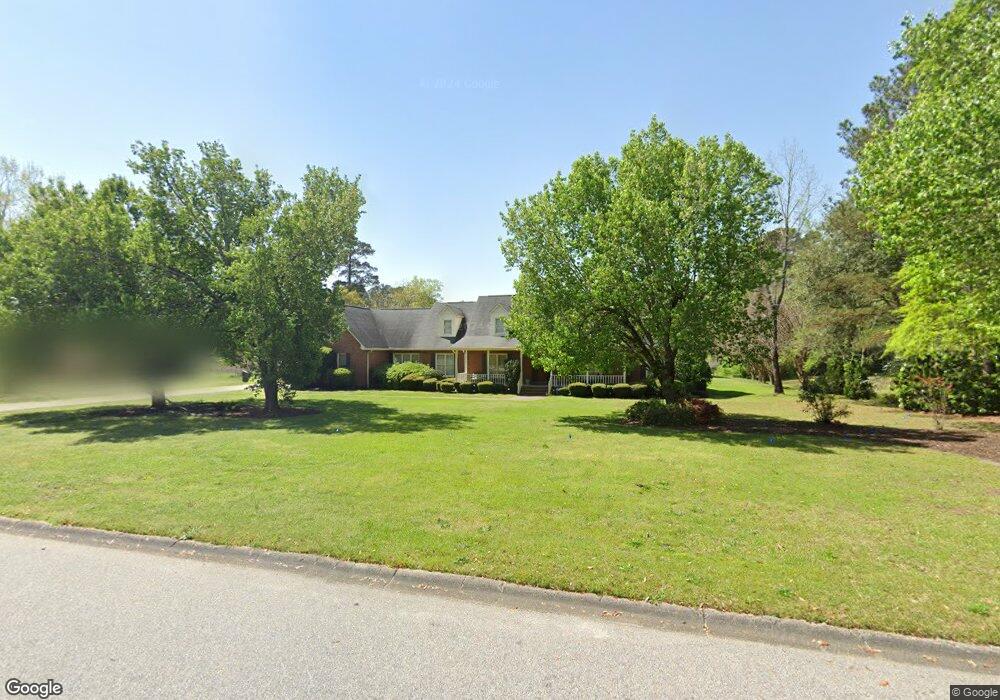
1120 Blakely Ct West Columbia, SC 29170
Springdale NeighborhoodEstimated Value: $533,000 - $757,620
4
Beds
5
Baths
5,612
Sq Ft
$118/Sq Ft
Est. Value
About This Home
This home is located at 1120 Blakely Ct, West Columbia, SC 29170 and is currently estimated at $664,155, approximately $118 per square foot. 1120 Blakely Ct is a home located in Lexington County with nearby schools including Springdale Elementary School, R. H. Fulmer Middle, and Airport High School.
Ownership History
Date
Name
Owned For
Owner Type
Purchase Details
Closed on
Nov 12, 2019
Sold by
Davis Edward C and Davis Megan M
Bought by
Davis Edward C and Davis Megan M
Current Estimated Value
Purchase Details
Closed on
Dec 22, 2005
Sold by
Kneece William H
Bought by
Davis Edward C and Davis Megan M
Home Financials for this Owner
Home Financials are based on the most recent Mortgage that was taken out on this home.
Original Mortgage
$70,000
Outstanding Balance
$39,159
Interest Rate
6.19%
Mortgage Type
Credit Line Revolving
Estimated Equity
$624,996
Purchase Details
Closed on
Jan 24, 2005
Sold by
Kneece Judy C
Bought by
Kneece William H
Create a Home Valuation Report for This Property
The Home Valuation Report is an in-depth analysis detailing your home's value as well as a comparison with similar homes in the area
Home Values in the Area
Average Home Value in this Area
Purchase History
| Date | Buyer | Sale Price | Title Company |
|---|---|---|---|
| Davis Edward C | -- | None Available | |
| Davis Edward C | $350,000 | -- | |
| Kneece William H | -- | -- |
Source: Public Records
Mortgage History
| Date | Status | Borrower | Loan Amount |
|---|---|---|---|
| Open | Davis Edward C | $70,000 | |
| Open | Davis Edward C | $280,000 |
Source: Public Records
Tax History Compared to Growth
Tax History
| Year | Tax Paid | Tax Assessment Tax Assessment Total Assessment is a certain percentage of the fair market value that is determined by local assessors to be the total taxable value of land and additions on the property. | Land | Improvement |
|---|---|---|---|---|
| 2024 | $4,453 | $20,333 | $2,100 | $18,233 |
| 2023 | $4,052 | $20,333 | $2,100 | $18,233 |
| 2022 | $4,055 | $20,333 | $2,100 | $18,233 |
| 2020 | $4,040 | $20,333 | $2,100 | $18,233 |
| 2019 | $3,431 | $17,005 | $2,100 | $14,905 |
| 2018 | $3,465 | $17,005 | $2,100 | $14,905 |
| 2017 | $3,371 | $17,005 | $2,100 | $14,905 |
| 2016 | $3,438 | $17,003 | $2,100 | $14,903 |
| 2014 | $2,457 | $15,721 | $2,100 | $13,621 |
| 2013 | -- | $15,560 | $2,100 | $13,460 |
Source: Public Records
Map
Nearby Homes
- 1112 Pine Croft Dr
- TBD Woodfield Jupiter & Daisey Track
- 2093 Durham Dr
- 2109 Durham Dr
- 2107 Durham Dr
- 826 Jefferson St
- 3027 Platt Springs Rd
- 2405 Rainbow Dr
- 602 Picadilly Square
- 601 Picadilly Square
- 1210 Decatur St
- 2312 Rainbow Dr
- 2525 Windsor Rd
- 725 Brooks Ave
- 1911 Toole St
- 2032 Pinewood St
- 706 Westside Dr
- 3002 Hilldale Rd
- 2017 Wellington Rd
- 1919 Windsor Dr
- 1122 Blakely Ct
- 1114 Blakely Ct
- 1124 Blakely Ct
- 1119 Blakely Ct
- 1117 Blakely Ct
- 1121 Blakely Ct
- 1105 Baywater Dr
- 1109 Baywater Dr
- 1115 Blakely Ct
- 1110 Blakely Ct
- 1120 Tarrytown Ln
- 1113 Baywater Dr
- 1122 Tarrytown Ln
- 1126 Blakely Ct
- 1125 Blakely Ct
- 1021 Lakewood Dr
- 1124 Tarrytown Ln
- 1111 Blakely Ct
- 1104 Baywater Dr
- 1108 Baywater Dr