
Seller's Agent in 2025
Susan Fisher
Coldwell Banker Realty
(815) 263-2276
1 in this area
375 Total Sales
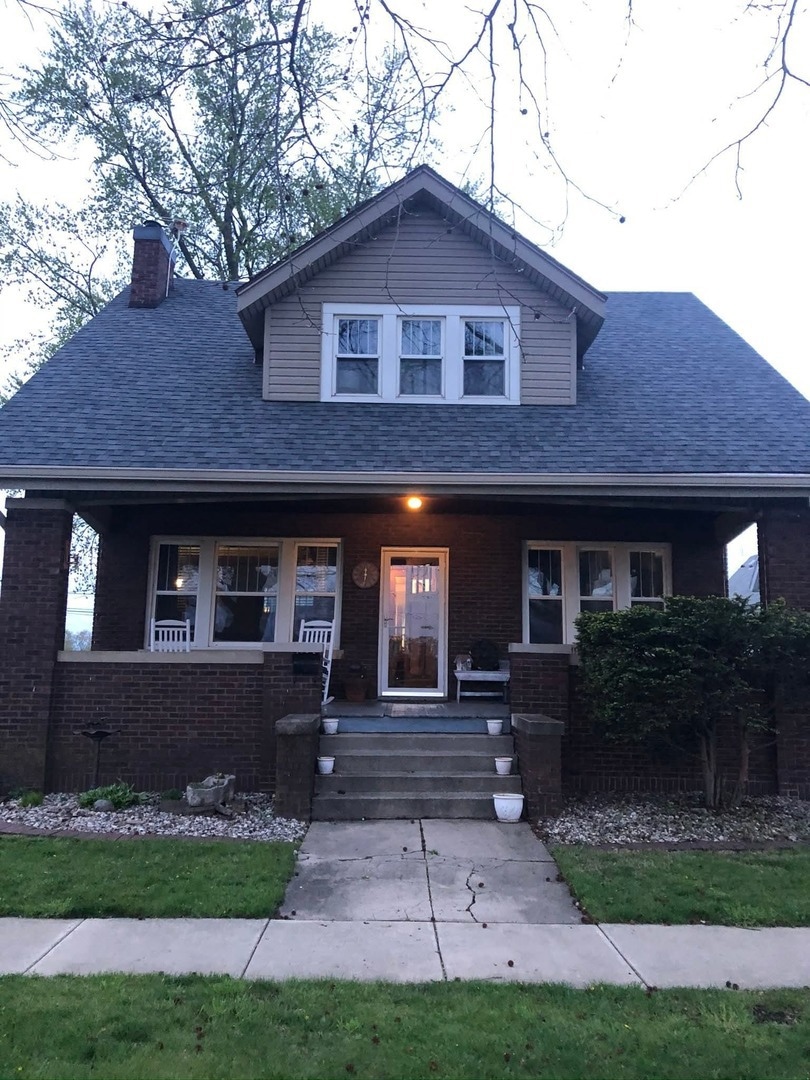
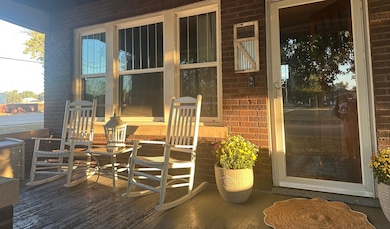
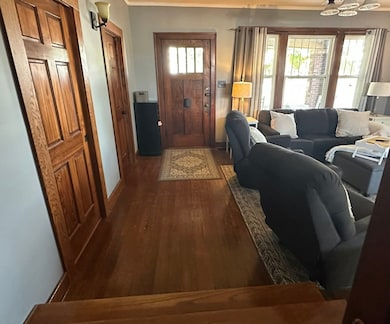
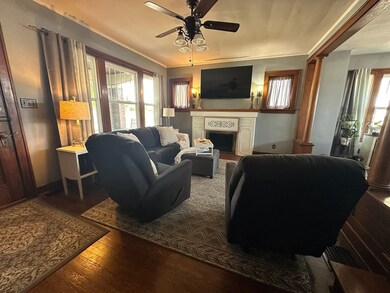
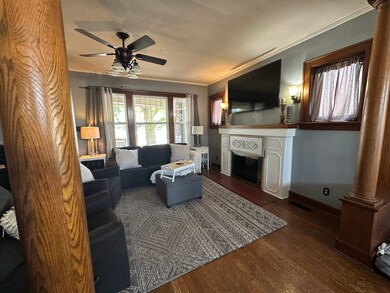
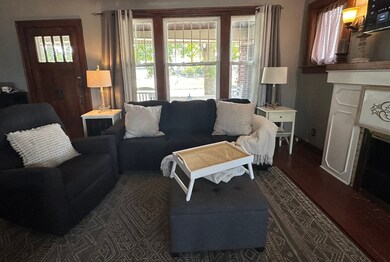
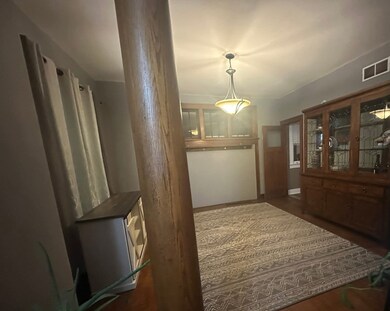
FALL IN LOVE with this charming FOUR bedroom, 1.5 bath brick Craftsman bungalow in the sweet heart of Mattoon! Fresh & modern updates highlight the timeless charm of the gleaming woodwork & vintage elements throughout: There is a sunny LR w/adorable fireplace; cool updated kitchen; beautiful dining room & large bedrooms, all w/original millwork. [BONUS: full unfinished basement; big ticket items - new roof & gutters, new water heater, new flooring & new stove - are already done.] Quality, comfort, and beauty are everywhere you look! The outdoor space is a treat: You have an awesome front porch overlooking a pretty lawn, and a fenced backyard w/fab deck, fire pit area, and plenty of room for fun & games. And what a great location: Set on a corner lot - on the Parade route! - and walking distance to parks & shops, with easy access to I57. An OUTSTANDING place to call home - come and see!
Last Agent to Sell the Property
Coldwell Banker Realty License #475133610 Listed on: 11/13/2025
Last Buyer's Agent
Non Member
NON MEMBER
| Date | Type | Sale Price | Title Company |
|---|---|---|---|
| Warranty Deed | $135,000 | Crites Title | |
| Quit Claim Deed | -- | None Listed On Document | |
| Warranty Deed | $81,500 | None Available | |
| Warranty Deed | $66,000 | None Available | |
| Warranty Deed | $65,000 | None Available |
| Date | Status | Loan Amount | Loan Type |
|---|---|---|---|
| Open | $137,464 | FHA | |
| Previous Owner | $77,425 | New Conventional | |
| Previous Owner | $52,800 | New Conventional |
| Date | Event | Price | List to Sale | Price per Sq Ft | Prior Sale |
|---|---|---|---|---|---|
| 12/22/2025 12/22/25 | Sold | $140,000 | -6.6% | $79 / Sq Ft | |
| 11/19/2025 11/19/25 | Pending | -- | -- | -- | |
| 11/13/2025 11/13/25 | For Sale | $149,900 | +83.9% | $85 / Sq Ft | |
| 09/14/2012 09/14/12 | Sold | $81,500 | 0.0% | $47 / Sq Ft | View Prior Sale |
| 08/01/2012 08/01/12 | Pending | -- | -- | -- | |
| 05/31/2012 05/31/12 | For Sale | $81,500 | -- | $47 / Sq Ft |
| Year | Tax Paid | Tax Assessment Tax Assessment Total Assessment is a certain percentage of the fair market value that is determined by local assessors to be the total taxable value of land and additions on the property. | Land | Improvement |
|---|---|---|---|---|
| 2024 | $2,581 | $30,371 | $3,731 | $26,640 |
| 2023 | $2,332 | $27,117 | $3,331 | $23,786 |
| 2022 | $2,332 | $26,669 | $3,276 | $23,393 |
| 2021 | $2,339 | $24,496 | $3,009 | $21,487 |
| 2020 | $2,314 | $25,381 | $3,118 | $22,263 |
| 2019 | $2,277 | $24,496 | $3,009 | $21,487 |
| 2018 | $2,238 | $24,496 | $3,009 | $21,487 |
| 2017 | $2,231 | $24,496 | $3,009 | $21,487 |
| 2016 | $2,184 | $24,496 | $3,009 | $21,487 |
| 2015 | $1,630 | $24,496 | $3,009 | $21,487 |
| 2014 | $1,630 | $24,496 | $3,009 | $21,487 |
| 2013 | $1,630 | $24,496 | $3,009 | $21,487 |
Seller's Agent in 2025
Susan Fisher
Coldwell Banker Realty
(815) 263-2276
1 in this area
375 Total Sales
N
Buyer's Agent in 2025
Non Member
NON MEMBER
T
Seller's Agent in 2012
Trisha Bird
Coldwell Banker Classic Real Estate
(217) 273-4872
47 in this area
91 Total Sales
Buyer's Agent in 2012
Janice Moritz
Century 21 Kima Properties
(217) 254-7210
111 in this area
161 Total Sales
Source: Midwest Real Estate Data (MRED)
MLS Number: 12517154
APN: 07-1-03884-000
Disclaimer: Certain information contained herein is derived from information provided by parties other than Homes.com. All information provided is deemed reliable, but is not guaranteed to be accurate and should be independently verified.
![]() Based on information submitted to the MLS GRID. All data is obtained from various sources and may not have been verified by broker or MLS GRID. Supplied Open House Information is subject to change without notice. All information should be independently reviewed and verified for accuracy. Properties may or may not be listed by the office/agent presenting the information. Some IDX listings have been excluded from this website.
Based on information submitted to the MLS GRID. All data is obtained from various sources and may not have been verified by broker or MLS GRID. Supplied Open House Information is subject to change without notice. All information should be independently reviewed and verified for accuracy. Properties may or may not be listed by the office/agent presenting the information. Some IDX listings have been excluded from this website.
Listings courtesy of Midwest Real Estate Data (MRED) as distributed by MLS GRID
Ask me questions while you tour the home.