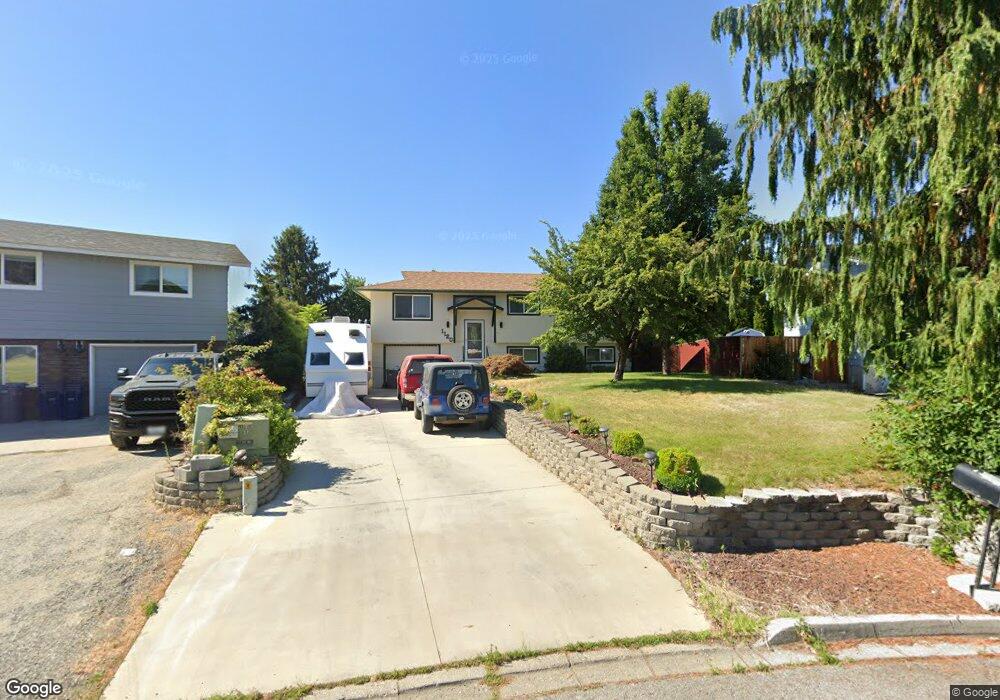
1120 Cherry Cir East Wenatchee, WA 98802
Estimated Value: $464,998 - $594,000
3
Beds
2
Baths
2,208
Sq Ft
$244/Sq Ft
Est. Value
About This Home
This home is located at 1120 Cherry Cir, East Wenatchee, WA 98802 and is currently estimated at $539,750, approximately $244 per square foot. 1120 Cherry Cir is a home located in Douglas County with nearby schools including Lee Elementary School, Sterling Intermediate School, and Eastmont Junior High School.
Ownership History
Date
Name
Owned For
Owner Type
Purchase Details
Closed on
Aug 22, 2018
Sold by
Thornton Lori K and Thornton Robert E
Bought by
Branca John R
Current Estimated Value
Home Financials for this Owner
Home Financials are based on the most recent Mortgage that was taken out on this home.
Original Mortgage
$324,300
Outstanding Balance
$281,641
Interest Rate
4.5%
Mortgage Type
New Conventional
Estimated Equity
$258,109
Purchase Details
Closed on
May 13, 2006
Sold by
Davies John E and Davies Jan E
Bought by
Tghornton Lori K and Tghornton Robert E
Home Financials for this Owner
Home Financials are based on the most recent Mortgage that was taken out on this home.
Original Mortgage
$108,000
Interest Rate
6.46%
Mortgage Type
New Conventional
Create a Home Valuation Report for This Property
The Home Valuation Report is an in-depth analysis detailing your home's value as well as a comparison with similar homes in the area
Home Values in the Area
Average Home Value in this Area
Purchase History
| Date | Buyer | Sale Price | Title Company |
|---|---|---|---|
| Branca John R | $401,373 | First American Title Ins Co | |
| Tghornton Lori K | -- | None Available |
Source: Public Records
Mortgage History
| Date | Status | Borrower | Loan Amount |
|---|---|---|---|
| Open | Branca John R | $324,300 | |
| Previous Owner | Tghornton Lori K | $108,000 |
Source: Public Records
Tax History Compared to Growth
Tax History
| Year | Tax Paid | Tax Assessment Tax Assessment Total Assessment is a certain percentage of the fair market value that is determined by local assessors to be the total taxable value of land and additions on the property. | Land | Improvement |
|---|---|---|---|---|
| 2025 | $260 | $407,700 | $100,000 | $307,700 |
| 2024 | $3,481 | $397,800 | $100,000 | $297,800 |
| 2023 | $3,651 | $361,900 | $100,000 | $261,900 |
| 2022 | $3,424 | $313,900 | $80,000 | $233,900 |
| 2021 | $3,535 | $313,900 | $80,000 | $233,900 |
| 2020 | $3,431 | $299,000 | $72,000 | $227,000 |
| 2018 | $3,280 | $272,200 | $60,000 | $212,200 |
| 2017 | $2,687 | $272,200 | $60,000 | $212,200 |
| 2016 | $2,452 | $240,500 | $60,000 | $180,500 |
| 2015 | $2,349 | $219,800 | $60,000 | $159,800 |
| 2014 | -- | $201,900 | $60,000 | $141,900 |
| 2013 | -- | $197,800 | $60,000 | $137,800 |
Source: Public Records
Map
Nearby Homes
- 1218 N Ashland Ave
- 1046 Corum Cir
- 1352 Eastmont Ave Unit 15
- 520 11th St NE Unit 21
- 1051 N Baker Ave Unit A-202
- 1051 N Baker Ave Unit B 203
- 1494 Eastmont Ave Unit 56
- 1494 Eastmont Ave Unit 33
- 1494 Eastmont Ave Unit 58
- 3234 NW Chadwick (Lot 25) Loop
- 845 N Devon Ave
- 1040 Gilbert Ct
- 1653 Holly Ln
- 544 N Colorado Ave
- 646 N Gale Place
- 1840 Country Club Dr
- 225 19th St NE Unit 31
- 225 19th St NE Unit 23
- 351 19th St NE Unit 26
- 351 19th St NE Unit 21
- 1116 Cherry Cir
- 1124 Cherry Cir
- 333 13th St NE
- 337 13th St NE
- 270 12th Place NE
- 343 13th St NE
- 1112 Cherry Cir
- 343 341 13th St NE
- 1128 Cherry Cir
- 233 13th St NE
- 345 13th St NE
- 1115 Cherry Cir
- 1132 Cherry Cir
- 1108 Cherry Cir
- 1136 Barton Square
- 231 13th St NE
- 258 12th Place NE
- 12 13th St SE
- 229 13th St NE
- 349 13th St NE