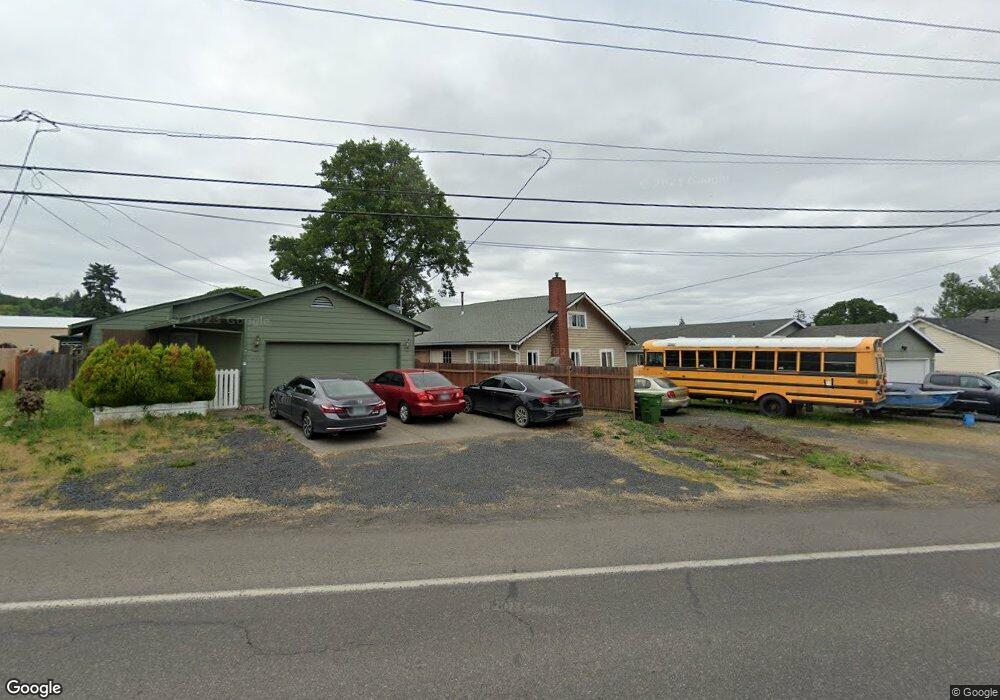
1120 Deer Island Rd Saint Helens, OR 97051
Estimated Value: $307,000 - $384,000
3
Beds
1
Bath
1,296
Sq Ft
$271/Sq Ft
Est. Value
About This Home
This home is located at 1120 Deer Island Rd, Saint Helens, OR 97051 and is currently estimated at $351,013, approximately $270 per square foot. 1120 Deer Island Rd is a home located in Columbia County with nearby schools including St. Helens High School and Columbia County Christian School.
Ownership History
Date
Name
Owned For
Owner Type
Purchase Details
Closed on
Aug 12, 2009
Sold by
Us Bank National Association
Bought by
Laird Ryan
Current Estimated Value
Home Financials for this Owner
Home Financials are based on the most recent Mortgage that was taken out on this home.
Original Mortgage
$83,361
Interest Rate
5.08%
Mortgage Type
FHA
Purchase Details
Closed on
Sep 30, 2008
Sold by
Jespersen Anthony M and Rey Elaine Jespersen A
Bought by
U S Bank Na and Certificateholders Of Asset Backed Secur
Purchase Details
Closed on
Dec 8, 2005
Sold by
Harrison Freddie and Harrison Kathleen
Bought by
Jespersen Anthony M and Rey Elaine Jespersen A
Home Financials for this Owner
Home Financials are based on the most recent Mortgage that was taken out on this home.
Original Mortgage
$102,800
Interest Rate
7.6%
Mortgage Type
Fannie Mae Freddie Mac
Create a Home Valuation Report for This Property
The Home Valuation Report is an in-depth analysis detailing your home's value as well as a comparison with similar homes in the area
Home Values in the Area
Average Home Value in this Area
Purchase History
| Date | Buyer | Sale Price | Title Company |
|---|---|---|---|
| Laird Ryan | $84,900 | Fidelity Natl Title Co Of Or | |
| U S Bank Na | $118,047 | None Available | |
| Jespersen Anthony M | $128,500 | Ticor Title |
Source: Public Records
Mortgage History
| Date | Status | Borrower | Loan Amount |
|---|---|---|---|
| Previous Owner | Laird Ryan | $83,361 | |
| Previous Owner | Jespersen Anthony M | $102,800 |
Source: Public Records
Tax History Compared to Growth
Tax History
| Year | Tax Paid | Tax Assessment Tax Assessment Total Assessment is a certain percentage of the fair market value that is determined by local assessors to be the total taxable value of land and additions on the property. | Land | Improvement |
|---|---|---|---|---|
| 2024 | $2,035 | $127,000 | $65,210 | $61,790 |
| 2023 | $2,004 | $123,310 | $60,090 | $63,220 |
| 2022 | $1,922 | $119,720 | $58,340 | $61,380 |
| 2021 | $1,755 | $116,240 | $59,220 | $57,020 |
| 2020 | $1,696 | $112,860 | $51,400 | $61,460 |
| 2019 | $1,670 | $109,580 | $49,480 | $60,100 |
| 2018 | $1,618 | $106,390 | $58,620 | $47,770 |
| 2017 | $1,573 | $103,300 | $56,910 | $46,390 |
| 2016 | $1,550 | $100,300 | $55,470 | $44,830 |
| 2015 | $1,454 | $97,380 | $56,790 | $40,590 |
| 2014 | $1,424 | $93,980 | $52,500 | $41,480 |
Source: Public Records
Map
Nearby Homes
- 1130 Deer Island Rd
- 1090 Deer Island Rd
- 1070 Deer Island Rd
- 1140 Deer Island Rd
- 555 N 10th St
- 551 N 10th St
- 513 N 10th St
- 565 N 10th St
- 523 N 10th St
- 583 N 10th St
- 565 N 11th St
- 534 N 11
- 575 S 10 St
- 555 N 11th St
- 1160 Deer Island Rd
- 585 N 10th St
- 545 N 11th St
- 1071 Deer Island Rd
- 545 N 11th Next To
- 524 N 11th St