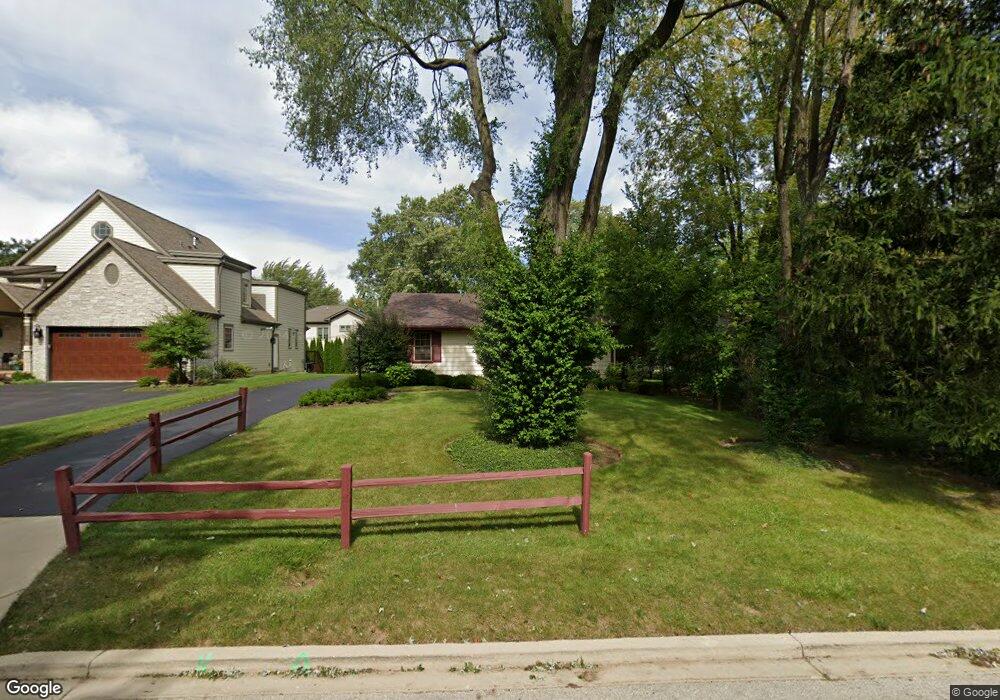
1120 Elmwood Ave Deerfield, IL 60015
Woodland NeighborhoodEstimated Value: $434,422 - $530,000
2
Beds
1
Bath
1,338
Sq Ft
$352/Sq Ft
Est. Value
About This Home
This home is located at 1120 Elmwood Ave, Deerfield, IL 60015 and is currently estimated at $471,106, approximately $352 per square foot. 1120 Elmwood Ave is a home located in Lake County with nearby schools including Walden Elementary School, Alan B Shepard Middle School, and Deerfield High School.
Ownership History
Date
Name
Owned For
Owner Type
Purchase Details
Closed on
Feb 12, 2017
Sold by
Natonson Leonne M
Bought by
Natonson Leonne M and Leonne M Natonson Trust
Current Estimated Value
Purchase Details
Closed on
Feb 11, 1997
Sold by
Mclachlan Gary V
Bought by
Mclachlan Gary V and Gary V Mclachlan Revocable Trust
Home Financials for this Owner
Home Financials are based on the most recent Mortgage that was taken out on this home.
Original Mortgage
$40,300
Interest Rate
7.58%
Purchase Details
Closed on
Dec 26, 1996
Sold by
Mclachlan Gary V
Bought by
Mclachlan Gary V
Home Financials for this Owner
Home Financials are based on the most recent Mortgage that was taken out on this home.
Original Mortgage
$40,300
Interest Rate
7.58%
Purchase Details
Closed on
Jan 19, 1994
Sold by
Mclachlan Gary V
Bought by
Mclachlan Gary V
Create a Home Valuation Report for This Property
The Home Valuation Report is an in-depth analysis detailing your home's value as well as a comparison with similar homes in the area
Home Values in the Area
Average Home Value in this Area
Purchase History
| Date | Buyer | Sale Price | Title Company |
|---|---|---|---|
| Natonson Leonne M | -- | Attorney | |
| Mclachlan Gary V | -- | -- | |
| Mclachlan Gary V | -- | Lenders Title Guaranty | |
| Mclachlan Gary V | -- | -- |
Source: Public Records
Mortgage History
| Date | Status | Borrower | Loan Amount |
|---|---|---|---|
| Closed | Mclachlan Gary V | $40,300 |
Source: Public Records
Tax History Compared to Growth
Tax History
| Year | Tax Paid | Tax Assessment Tax Assessment Total Assessment is a certain percentage of the fair market value that is determined by local assessors to be the total taxable value of land and additions on the property. | Land | Improvement |
|---|---|---|---|---|
| 2024 | $7,764 | $113,107 | $41,008 | $72,099 |
| 2023 | $8,290 | $108,548 | $39,355 | $69,193 |
| 2022 | $8,290 | $102,073 | $42,270 | $59,803 |
| 2021 | $8,118 | $98,412 | $40,754 | $57,658 |
| 2020 | $7,794 | $98,619 | $40,840 | $57,779 |
| 2019 | $7,525 | $98,452 | $40,771 | $57,681 |
| 2018 | $7,872 | $105,024 | $43,214 | $61,810 |
| 2017 | $7,808 | $104,689 | $43,076 | $61,613 |
| 2016 | $5,863 | $100,730 | $41,447 | $59,283 |
| 2015 | $6,122 | $94,644 | $38,943 | $55,701 |
| 2014 | $6,268 | $83,862 | $39,222 | $44,640 |
| 2012 | $5,947 | $83,122 | $38,876 | $44,246 |
Source: Public Records
Map
Nearby Homes
- 1131 Linden Ave
- 1342 Barclay Ln Unit 36
- 1444 Crowe Ave
- 1265 Woodland Dr
- 1045 Fairoaks Ave
- 1410 Berkley Ct
- 1504 Northwoods Rd
- 1423 Northwoods Rd
- 1041 Sheridan Ave
- 1770 Overland Trail
- 904 Forest Ave
- 602 Warwick Rd
- 926 Cedar St
- 828 Chestnut St
- 1620 Berkeley Ct
- 1015 Deerfield Rd Unit 135
- 1119 Hampton Ct Unit 1
- 816 Appletree Ln
- 1127 Kenton Rd
- 1630 Ridge Rd
- 1126 Elmwood Ave
- 1112 Elnwoo Ave
- 1112 Elmwood Ave
- 1132 Elmwood Ave
- 1121 Linden Ave
- 1125 Linden Ave
- 1111 Linden Ave
- 1102 Elmwood Ave
- 1138 Elmwood Ave
- 1119 Elmwood Ave
- 1121 Elmwood Ave
- 1115 Elmwood Ave
- 1101 Linden Ave
- 1133 Elmwood Ave
- 1109 Elmwood Ave
- 1144 Elmwood Ave
- 1060 Elmwood Ave
- 1139 Linden Ave
- 1139 Elmwood Ave
- 1103 Elmwood Ave