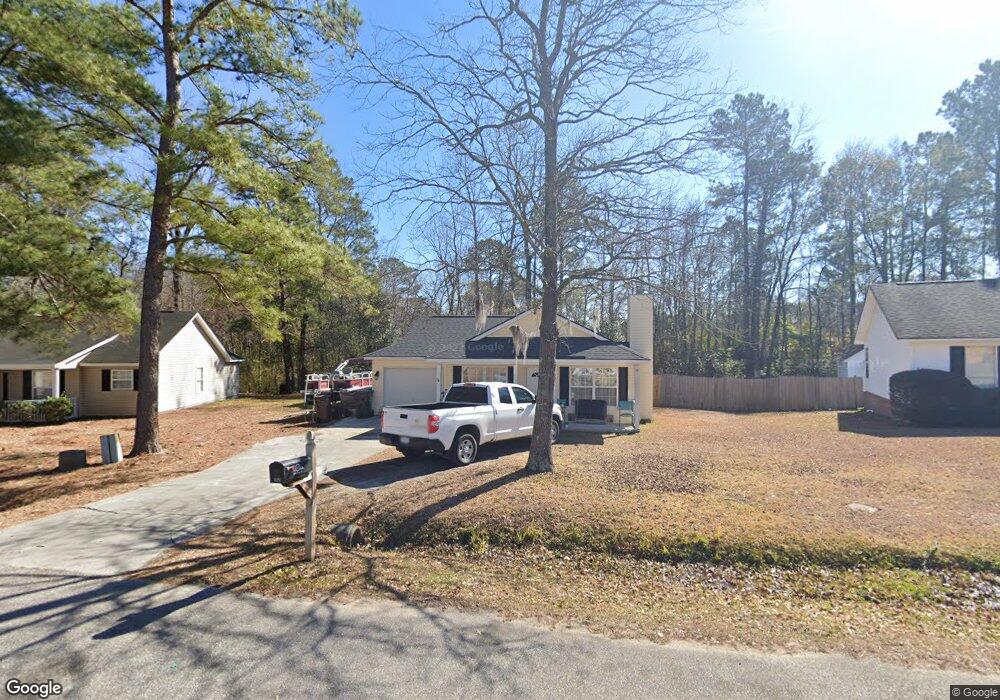
1120 Huger St Moncks Corner, SC 29461
Estimated Value: $218,000 - $272,961
3
Beds
2
Baths
1,071
Sq Ft
$235/Sq Ft
Est. Value
About This Home
This home is located at 1120 Huger St, Moncks Corner, SC 29461 and is currently estimated at $251,490, approximately $234 per square foot. 1120 Huger St is a home located in Berkeley County with nearby schools including Moncks Corner Elementary School, Berkeley Middle School, and Berkeley High School.
Ownership History
Date
Name
Owned For
Owner Type
Purchase Details
Closed on
Apr 26, 2012
Sold by
Thornton David L
Bought by
Rabon Dana L and Rabon Stephen D
Current Estimated Value
Purchase Details
Closed on
Sep 29, 2006
Sold by
Augustine Thomas G and Augustine Tracy F
Bought by
Thornton David L
Home Financials for this Owner
Home Financials are based on the most recent Mortgage that was taken out on this home.
Original Mortgage
$114,985
Interest Rate
6.48%
Mortgage Type
Future Advance Clause Open End Mortgage
Purchase Details
Closed on
Jun 28, 2004
Sold by
Still Joseph E
Bought by
Augustine Ii Thomas G and Augustine Tracy F
Purchase Details
Closed on
Jul 9, 2002
Sold by
Keller E P
Bought by
Still Joseph E
Purchase Details
Closed on
Oct 17, 2001
Sold by
E P Keller Builders Inc
Bought by
Keller E P
Purchase Details
Closed on
Jan 6, 2001
Sold by
Amg Development Inc
Bought by
E P Keller Builders Inc
Purchase Details
Closed on
Mar 31, 2000
Sold by
Frier Sheila L
Bought by
Amg Development Inc
Create a Home Valuation Report for This Property
The Home Valuation Report is an in-depth analysis detailing your home's value as well as a comparison with similar homes in the area
Home Values in the Area
Average Home Value in this Area
Purchase History
| Date | Buyer | Sale Price | Title Company |
|---|---|---|---|
| Rabon Dana L | $100,000 | -- | |
| Thornton David L | $130,000 | None Available | |
| Augustine Ii Thomas G | $112,900 | -- | |
| Still Joseph E | $91,000 | -- | |
| Keller E P | $12,000 | -- | |
| E P Keller Builders Inc | $43,000 | -- | |
| Amg Development Inc | $14,400 | -- |
Source: Public Records
Mortgage History
| Date | Status | Borrower | Loan Amount |
|---|---|---|---|
| Previous Owner | Thornton David L | $114,985 |
Source: Public Records
Tax History Compared to Growth
Tax History
| Year | Tax Paid | Tax Assessment Tax Assessment Total Assessment is a certain percentage of the fair market value that is determined by local assessors to be the total taxable value of land and additions on the property. | Land | Improvement |
|---|---|---|---|---|
| 2025 | $1,064 | $141,375 | $36,767 | $104,608 |
| 2024 | $1,064 | $5,655 | $1,471 | $4,184 |
| 2023 | $1,064 | $5,655 | $1,471 | $4,184 |
| 2022 | $1,027 | $4,917 | $910 | $4,007 |
| 2021 | $988 | $4,920 | $910 | $4,007 |
| 2020 | $1,028 | $4,917 | $910 | $4,007 |
| 2019 | $1,018 | $4,917 | $910 | $4,007 |
| 2018 | $886 | $4,276 | $1,200 | $3,076 |
| 2017 | $889 | $4,276 | $1,200 | $3,076 |
| 2016 | $750 | $4,280 | $1,200 | $3,080 |
| 2015 | $651 | $4,280 | $1,200 | $3,080 |
| 2014 | $642 | $4,280 | $1,200 | $3,080 |
| 2013 | -- | $4,280 | $1,200 | $3,080 |
Source: Public Records
Map
Nearby Homes
- 417 Dennis Ave
- 00 Highway 52
- 476 Rockville Rd
- 210 Heatley St
- 407 Jenna Ln
- 605 E Main St
- 816 Alma Square Dr
- 1101 Stuart Dr
- 812 Alma Square Dr
- 000 Abercom Place Dr
- 207 Allen Richard Ct Unit B
- 822 Alma Square Dr
- 814 Alma Square Dr
- 823 Alma Square Dr
- 825 Alma Square Dr
- 826 Alma Square Dr
- 818 Alma Square Dr
- 819 Alma Square Dr
- 821 Alma Square Dr
- 813 Alma Square Dr