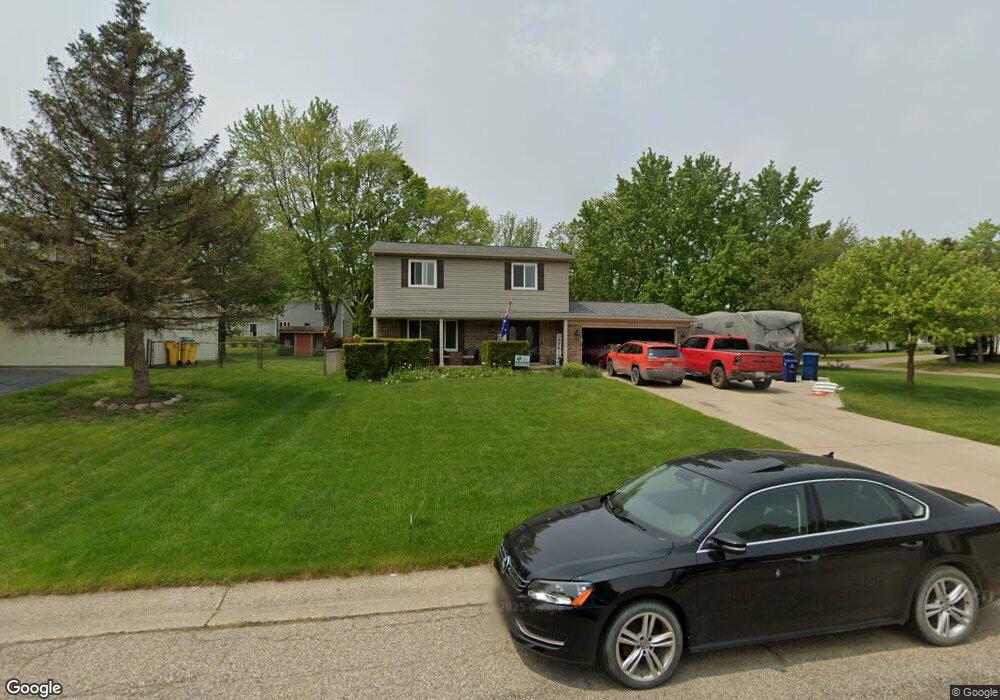
1120 Keble Ln Oxford, MI 48371
Estimated Value: $350,939 - $399,000
3
Beds
2
Baths
1,687
Sq Ft
$219/Sq Ft
Est. Value
About This Home
This home is located at 1120 Keble Ln, Oxford, MI 48371 and is currently estimated at $369,735, approximately $219 per square foot. 1120 Keble Ln is a home located in Oakland County with nearby schools including Clear Lake Elementary School, Oxford Middle School, and Oxford High School.
Ownership History
Date
Name
Owned For
Owner Type
Purchase Details
Closed on
Nov 15, 2017
Sold by
Polley Rollano and Polley Doris
Bought by
Yeager David C
Current Estimated Value
Purchase Details
Closed on
Nov 19, 2007
Sold by
Frb Venture 101 and Mezsets Kristen J
Bought by
Polley Ronald and Polley Doris
Purchase Details
Closed on
Nov 17, 2006
Sold by
The Cit Group/Consumer Finance Inc and Johnson Darrell
Bought by
Rock Homes Llc
Purchase Details
Closed on
Jan 17, 2006
Sold by
Thompson Carlotta M and Thompson Robert A
Bought by
The Cit Group/Consumer Finance Llc
Purchase Details
Closed on
Jan 10, 2000
Sold by
Ferrell Jeffrey W
Bought by
Thompson Robert A
Home Financials for this Owner
Home Financials are based on the most recent Mortgage that was taken out on this home.
Original Mortgage
$114,520
Interest Rate
7.98%
Create a Home Valuation Report for This Property
The Home Valuation Report is an in-depth analysis detailing your home's value as well as a comparison with similar homes in the area
Home Values in the Area
Average Home Value in this Area
Purchase History
| Date | Buyer | Sale Price | Title Company |
|---|---|---|---|
| Yeager David C | -- | None Available | |
| Polley Ronald | $164,000 | None Available | |
| Rock Homes Llc | $95,000 | Metropolitan Title Company | |
| Frb Venture 101 | -- | None Available | |
| The Cit Group/Consumer Finance Llc | $172,200 | None Available | |
| Thompson Robert A | $163,000 | -- |
Source: Public Records
Mortgage History
| Date | Status | Borrower | Loan Amount |
|---|---|---|---|
| Previous Owner | Thompson Robert A | $114,520 |
Source: Public Records
Tax History Compared to Growth
Tax History
| Year | Tax Paid | Tax Assessment Tax Assessment Total Assessment is a certain percentage of the fair market value that is determined by local assessors to be the total taxable value of land and additions on the property. | Land | Improvement |
|---|---|---|---|---|
| 2024 | $1,785 | $152,760 | $0 | $0 |
| 2023 | $1,703 | $139,710 | $0 | $0 |
| 2022 | $2,636 | $130,600 | $0 | $0 |
| 2021 | $2,519 | $123,410 | $0 | $0 |
| 2020 | $1,609 | $117,800 | $0 | $0 |
| 2019 | $2,353 | $112,890 | $0 | $0 |
| 2018 | $2,308 | $104,980 | $0 | $0 |
| 2017 | $2,215 | $101,440 | $0 | $0 |
| 2016 | $2,211 | $95,930 | $0 | $0 |
| 2015 | -- | $89,590 | $0 | $0 |
| 2014 | -- | $82,770 | $0 | $0 |
| 2011 | -- | $66,660 | $0 | $0 |
Source: Public Records
Map
Nearby Homes
- 967 Keith St
- 2060 W Drahner Rd
- 1844 Chesapeake Ct
- 774 Keith St
- 1612 Royal Birkdale Dr Unit 77
- 1628 Royal Birkdale Dr Unit 76
- 1667 Royal Birkdale Dr
- 1611 Harwood Dr
- 1910 Royal Birkdale Dr
- 1320 W Drahner Rd
- 1315 Beemer Ct
- 302 Tanview Dr
- 1 Pinery Ct
- 1858 Sandy Shores Dr
- 1904 Sandy Shores Dr
- 1126 Watersmeet Dr
- 1974 Sandy Shores Dr
- 1531 Seymour Lake Rd
- 815 Pinery Blvd
- 1060 Tinley Blvd