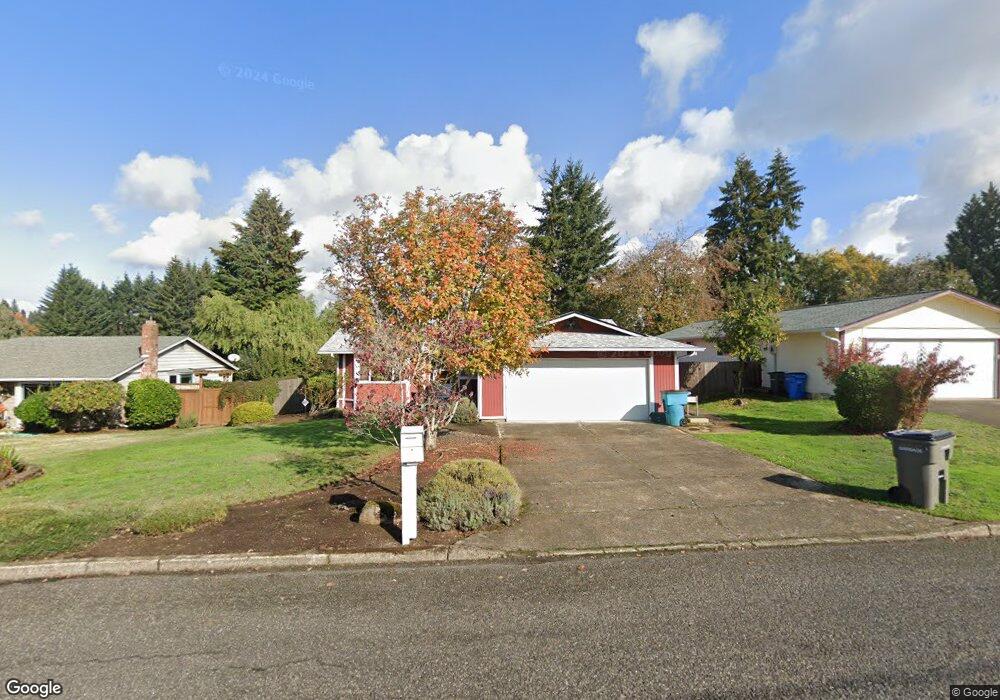
1120 NW Sluman Rd Vancouver, WA 98665
West Hazel Dell NeighborhoodEstimated Value: $440,918 - $499,000
3
Beds
3
Baths
1,256
Sq Ft
$378/Sq Ft
Est. Value
About This Home
This home is located at 1120 NW Sluman Rd, Vancouver, WA 98665 and is currently estimated at $474,230, approximately $377 per square foot. 1120 NW Sluman Rd is a home located in Clark County with nearby schools including Hazel Dell Elementary School, Jason Lee Middle School, and Hudson's Bay High School.
Ownership History
Date
Name
Owned For
Owner Type
Purchase Details
Closed on
May 24, 2005
Sold by
Bjerke Erik and Bjerke Wendy
Bought by
Gruett Gary D and Gruett Beverly F
Current Estimated Value
Home Financials for this Owner
Home Financials are based on the most recent Mortgage that was taken out on this home.
Original Mortgage
$100,900
Outstanding Balance
$52,271
Interest Rate
5.74%
Mortgage Type
Fannie Mae Freddie Mac
Estimated Equity
$421,959
Purchase Details
Closed on
Apr 7, 2005
Sold by
Bjerke Scott D and Bjerke Beckey J
Bought by
Bjerke Erik and Bjerke Wendy
Home Financials for this Owner
Home Financials are based on the most recent Mortgage that was taken out on this home.
Original Mortgage
$100,900
Outstanding Balance
$52,271
Interest Rate
5.74%
Mortgage Type
Fannie Mae Freddie Mac
Estimated Equity
$421,959
Purchase Details
Closed on
Apr 25, 2002
Sold by
Trimble Phyllis
Bought by
Bjerke Scott D and Bjerke Beckey J
Create a Home Valuation Report for This Property
The Home Valuation Report is an in-depth analysis detailing your home's value as well as a comparison with similar homes in the area
Home Values in the Area
Average Home Value in this Area
Purchase History
| Date | Buyer | Sale Price | Title Company |
|---|---|---|---|
| Gruett Gary D | $185,900 | Chicago Title Insurance | |
| Bjerke Erik | -- | -- | |
| Bjerke Scott D | -- | Clark County Title |
Source: Public Records
Mortgage History
| Date | Status | Borrower | Loan Amount |
|---|---|---|---|
| Open | Gruett Gary D | $100,900 |
Source: Public Records
Tax History Compared to Growth
Tax History
| Year | Tax Paid | Tax Assessment Tax Assessment Total Assessment is a certain percentage of the fair market value that is determined by local assessors to be the total taxable value of land and additions on the property. | Land | Improvement |
|---|---|---|---|---|
| 2025 | $4,242 | $439,192 | $196,000 | $243,192 |
| 2024 | $4,088 | $399,278 | $196,000 | $203,278 |
| 2023 | $3,784 | $419,496 | $188,000 | $231,496 |
| 2022 | $3,581 | $382,440 | $188,000 | $194,440 |
| 2021 | $3,410 | $322,207 | $133,000 | $189,207 |
| 2020 | $3,161 | $287,880 | $118,300 | $169,580 |
| 2019 | $2,802 | $283,405 | $118,300 | $165,105 |
| 2018 | $2,839 | $260,315 | $0 | $0 |
| 2017 | $2,588 | $219,568 | $0 | $0 |
| 2016 | $2,498 | $207,876 | $0 | $0 |
| 2015 | $2,465 | $187,518 | $0 | $0 |
| 2014 | -- | $178,684 | $0 | $0 |
| 2013 | -- | $162,510 | $0 | $0 |
Source: Public Records
Map
Nearby Homes
- 1215 NW 76th Cir
- 721 NW 76th St
- 7617 NW 16th Ave
- 7800 NW 10th Ct
- 1519 NW 79th Cir
- 6910 NW Anderson Ave
- 606 NW 78th St
- 1702 NW Gregory Dr
- 502 NW 77th St
- 2405 NW 68th St
- 6612 NW 5th Ave
- 506 NW 82nd St
- 503 NW Overlook Dr
- 2205 NW 69th St
- 6114 NW Cherry St
- 6103 NW Bernie Dr
- 6014 NW Kauffman Ave
- 6015 NW Perthshire Rd
- 8621 NW 15th Ave
- 136 NE 76th St
- 1114 NW Sluman Rd
- 1200 NW Sluman Rd
- 1113 NW 75th Cir
- 1206 NW Sluman Rd
- 1108 NW Sluman Rd
- 1105 NW 75th Cir
- 7305 NW Overlook Dr
- 1117 NW 75th Cir
- 1212 NW Sluman Rd
- 1100 NW Sluman Rd
- 7215 NW Overlook Dr
- 7306 7308 NW Overlook Dr
- 1201 NW 75th Cir
- 1104 NW 75th Cir
- 7310 NW 11th Ave
- 7306 NW Overlook Dr
- 7400 NW 11th Ave
- 1209 NW Sluman Rd
- 1016 NW Sluman Rd