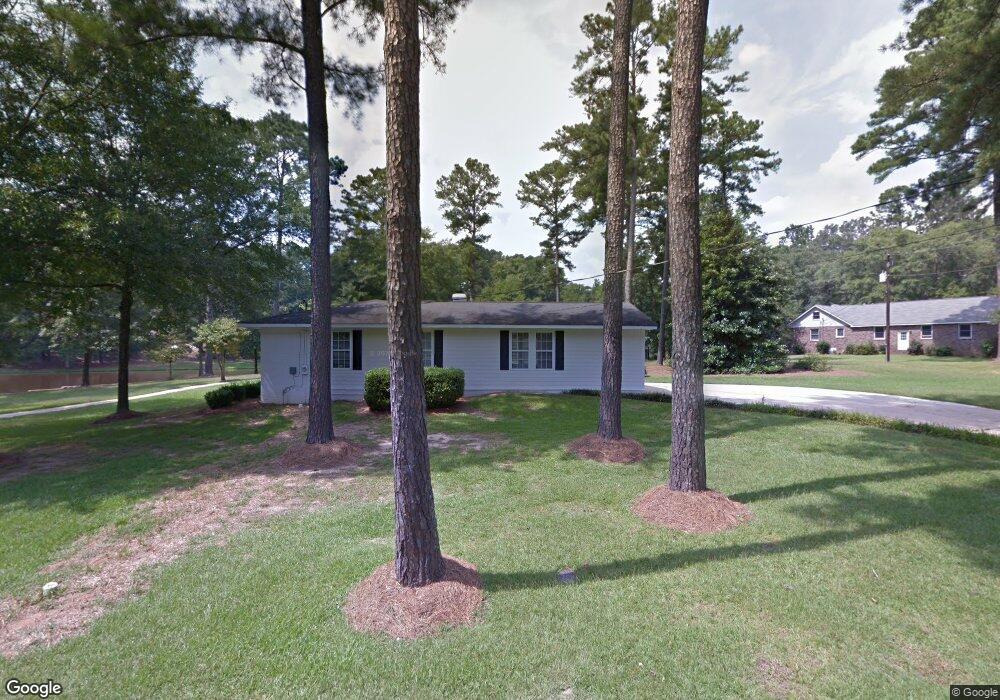
1120 Phelps Rd Greensboro, GA 30642
Estimated Value: $525,000 - $608,000
4
Beds
3
Baths
2,811
Sq Ft
$197/Sq Ft
Est. Value
About This Home
This home is located at 1120 Phelps Rd, Greensboro, GA 30642 and is currently estimated at $553,061, approximately $196 per square foot. 1120 Phelps Rd is a home located in Greene County with nearby schools including Greene County High School.
Ownership History
Date
Name
Owned For
Owner Type
Purchase Details
Closed on
Aug 9, 2011
Sold by
Hollrah Dale E
Bought by
Westergren Ronald and Torbert Gerald W
Current Estimated Value
Purchase Details
Closed on
Mar 2, 2011
Sold by
Hollrah Dale E and Hollrah Elaine C
Bought by
Hollrah Dale E and Hollrah Elaine C
Purchase Details
Closed on
Feb 19, 2010
Sold by
Hollrah Elaine C
Bought by
Hollrah Elaine C and Hollrah Dale E
Purchase Details
Closed on
Aug 2, 2002
Sold by
Phelps Pond Access and Maint Agree
Bought by
Hollrah Dale E and Hollrah Elaine C
Purchase Details
Closed on
Sep 24, 2001
Sold by
Phelps Lucile Smith
Bought by
Phelps Pond Access and Maint Agree
Purchase Details
Closed on
Jun 30, 1998
Sold by
Phelps Lucile Smith
Bought by
Phelps Lucile Smith
Purchase Details
Closed on
Oct 1, 1997
Sold by
Phelps Lucile Smith
Bought by
Phelps Lucile Smith
Purchase Details
Closed on
Jul 24, 1997
Sold by
Phelps Winthrop
Bought by
Phelps Lucile Smith
Create a Home Valuation Report for This Property
The Home Valuation Report is an in-depth analysis detailing your home's value as well as a comparison with similar homes in the area
Home Values in the Area
Average Home Value in this Area
Purchase History
| Date | Buyer | Sale Price | Title Company |
|---|---|---|---|
| Westergren Ronald | -- | -- | |
| Hollrah Dale E | -- | -- | |
| Hollrah Elaine C | -- | -- | |
| Hollrah Dale E | -- | -- | |
| Hollrah Dale E | $158,500 | -- | |
| Phelps Pond Access | -- | -- | |
| Phelps Lucile Smith | -- | -- | |
| Phelps Lucile Smith | -- | -- | |
| Phelps Lucile Smith | -- | -- |
Source: Public Records
Tax History Compared to Growth
Tax History
| Year | Tax Paid | Tax Assessment Tax Assessment Total Assessment is a certain percentage of the fair market value that is determined by local assessors to be the total taxable value of land and additions on the property. | Land | Improvement |
|---|---|---|---|---|
| 2024 | $3,760 | $173,240 | $29,320 | $143,920 |
| 2023 | $2,454 | $148,320 | $18,880 | $129,440 |
| 2022 | $2,435 | $133,720 | $18,880 | $114,840 |
| 2021 | $2,348 | $120,480 | $18,880 | $101,600 |
| 2020 | $1,632 | $73,360 | $27,440 | $45,920 |
| 2019 | $1,704 | $73,360 | $27,440 | $45,920 |
| 2018 | $1,683 | $73,360 | $27,440 | $45,920 |
| 2017 | $1,561 | $72,407 | $27,455 | $44,952 |
| 2016 | $1,594 | $74,099 | $27,455 | $46,644 |
| 2015 | $1,543 | $74,098 | $27,455 | $46,644 |
| 2014 | $1,494 | $69,693 | $27,455 | $42,238 |
Source: Public Records
Map
Nearby Homes
- 1531 E Broad St
- 0 Railroad St Unit 218854
- 0 Railroad St Unit 10578007
- 0 Railroad St Unit 531919
- 1020 Horton Dr
- LOT 1 Penfield
- 301 N East St
- 1060 Twin Pines Cir
- 1131 Planing Mill Rd
- 1141 Planing Mill Rd
- 15 South St Unit Siloam Road
- 504 Martin Luther King Junior Dr
- 0 Canaan St
- 314 W South St
- 109 Reynolds Dr
- 0 Maple Cir
- 105 Wilson St
- 805 S West St
- 1061 Grimes St
- 1141 Armour Cir
- 1120 Phelps Lake
- 1122 Phelps Lake
- 1122 Phelps Rd
- 1100 Phelps Dr
- 1100 Phelps Rd
- 1010 Ivy Ln
- 1102 Phelps Rd
- 1211 Webb Lake Dr
- 1128 Phelps Dr
- 1128 Phelps Rd
- 0 Ivy Ln
- 0 Phelps Dr Unit 8796691
- 0 Phelps Dr Unit 8756034
- 0 Phelps Dr Unit 8176918
- 0 Phelps Dr Unit 7429407
- 0 Phelps Dr Unit 7250642
- 0 Phelps Dr Unit 7113622
- 0 Phelps Dr
- 1090 Phelps Rd
- 1011 Ivy Ln