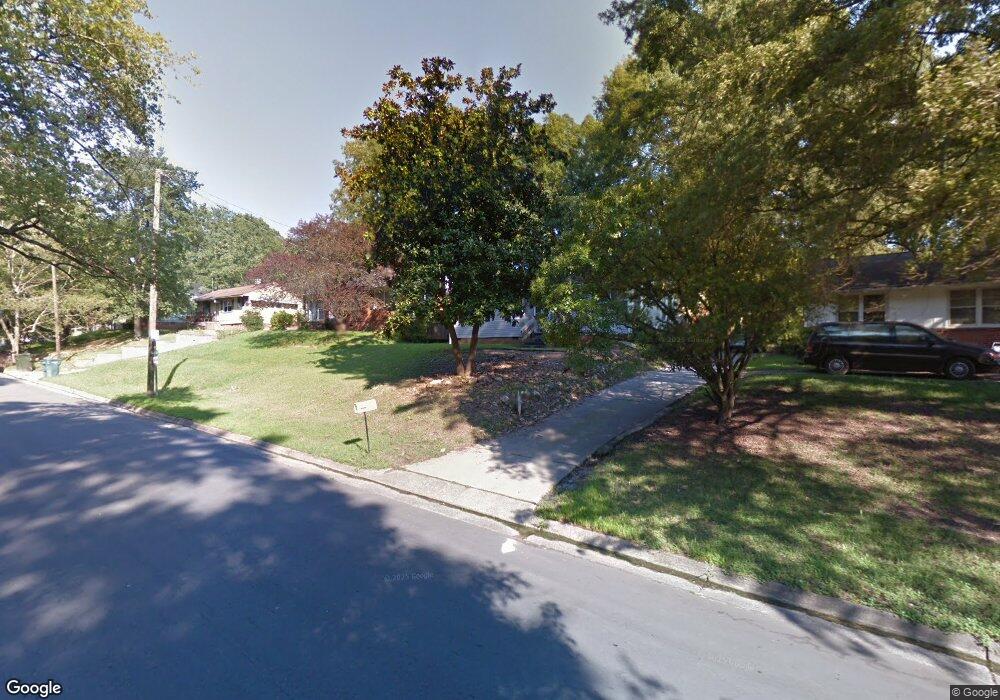
1120 Raynor St Durham, NC 27703
East Durham NeighborhoodEstimated Value: $216,000 - $266,000
3
Beds
2
Baths
1,387
Sq Ft
$179/Sq Ft
Est. Value
About This Home
This home is located at 1120 Raynor St, Durham, NC 27703 and is currently estimated at $248,042, approximately $178 per square foot. 1120 Raynor St is a home located in Durham County with nearby schools including Y E Smith Elementary, W.G. Pearson Elementary School, and Brogden Middle.
Ownership History
Date
Name
Owned For
Owner Type
Purchase Details
Closed on
Mar 17, 2016
Sold by
Felder Frank Christian
Bought by
Lhp Properties Llc
Current Estimated Value
Home Financials for this Owner
Home Financials are based on the most recent Mortgage that was taken out on this home.
Original Mortgage
$76,000
Outstanding Balance
$60,134
Interest Rate
3.64%
Estimated Equity
$187,908
Purchase Details
Closed on
Sep 17, 2007
Sold by
Branch Banking & Trust Co
Bought by
Felder Frank Christian
Purchase Details
Closed on
Mar 20, 2007
Sold by
Haskins Angela G and Haskins William
Bought by
Branch Banking & Trust Co
Purchase Details
Closed on
Aug 31, 1999
Sold by
Brunson Arthur and Wife Angela T
Bought by
Haskins William and Haskins Angela
Home Financials for this Owner
Home Financials are based on the most recent Mortgage that was taken out on this home.
Original Mortgage
$70,700
Interest Rate
7.5%
Create a Home Valuation Report for This Property
The Home Valuation Report is an in-depth analysis detailing your home's value as well as a comparison with similar homes in the area
Home Values in the Area
Average Home Value in this Area
Purchase History
| Date | Buyer | Sale Price | Title Company |
|---|---|---|---|
| Lhp Properties Llc | $81,000 | -- | |
| Felder Frank Christian | $50,000 | None Available | |
| Branch Banking & Trust Co | $68,820 | None Available | |
| Haskins William | $73,000 | -- |
Source: Public Records
Mortgage History
| Date | Status | Borrower | Loan Amount |
|---|---|---|---|
| Open | Lhp Properties Llc | $76,000 | |
| Previous Owner | Haskins William | $70,700 |
Source: Public Records
Tax History
| Year | Tax Paid | Tax Assessment Tax Assessment Total Assessment is a certain percentage of the fair market value that is determined by local assessors to be the total taxable value of land and additions on the property. | Land | Improvement |
|---|---|---|---|---|
| 2025 | $2,433 | $245,470 | $91,500 | $153,970 |
| 2024 | $1,656 | $118,707 | $18,360 | $100,347 |
| 2023 | $1,555 | $118,707 | $18,360 | $100,347 |
| 2022 | $1,519 | $118,707 | $18,360 | $100,347 |
| 2021 | $1,512 | $118,707 | $18,360 | $100,347 |
| 2020 | $1,477 | $118,707 | $18,360 | $100,347 |
| 2019 | $1,477 | $118,707 | $18,360 | $100,347 |
| 2018 | $1,239 | $91,365 | $21,420 | $69,945 |
| 2017 | $1,230 | $91,365 | $21,420 | $69,945 |
| 2016 | $1,189 | $91,365 | $21,420 | $69,945 |
| 2015 | $1,350 | $97,503 | $19,138 | $78,365 |
| 2014 | $1,350 | $97,503 | $19,138 | $78,365 |
Source: Public Records
Map
Nearby Homes
- 1116 Delano St
- 1147 Delano St
- 1139 N Miami Blvd
- 681 Muldee St
- 113 Herbert St
- 612 Raynor St
- 610 Raynor St
- 1601 Lathrop St
- 1606C Juniper St
- 1606 Juniper St
- 1606D Juniper St
- 212 Southerland St
- 702 Brye St
- 504 Raynor St
- 1609 Juniper St
- 1704 Liberty St
- 1501 Lathrop St
- 1505 Juniper St
- 525 N Hoover Rd
- 1004 Park Ave
- 1118 Raynor St
- 1124 Raynor St
- 1116 Raynor St
- 1126 Raynor St
- 1113 Wellons Dr
- 1115 Wellons Dr
- 1111 Wellons Dr
- 1117 Wellons Dr
- 1112 Raynor St
- 1128 Raynor St
- 1125 Raynor St
- 1107 Wellons Dr
- 1119 Raynor St
- 1121 Wellons Dr
- 1127 Raynor St
- 1117 Raynor St
- 1110 Raynor St
- 1132 Raynor St
- 1105 Wellons Dr
- 1129 Raynor St
Your Personal Tour Guide
Ask me questions while you tour the home.