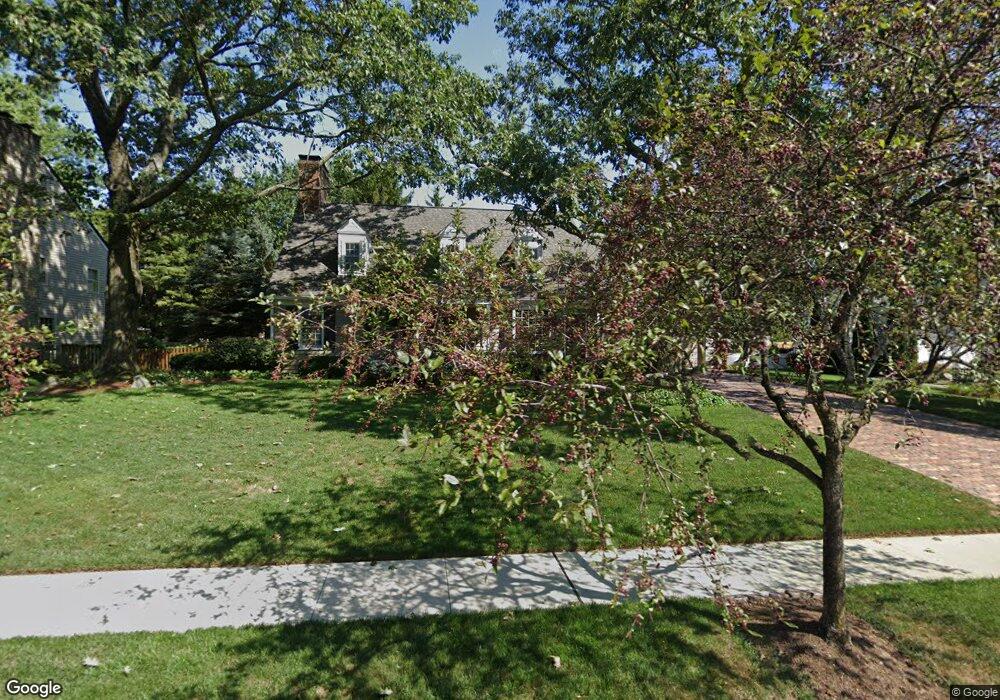
1120 Regency Dr Columbus, OH 43220
Estimated Value: $662,000 - $1,019,000
4
Beds
3
Baths
2,710
Sq Ft
$298/Sq Ft
Est. Value
About This Home
This home is located at 1120 Regency Dr, Columbus, OH 43220 and is currently estimated at $807,542, approximately $297 per square foot. 1120 Regency Dr is a home located in Franklin County with nearby schools including Greensview Elementary School, Hastings Middle School, and Upper Arlington High School.
Ownership History
Date
Name
Owned For
Owner Type
Purchase Details
Closed on
May 23, 2018
Sold by
Knab Janet S and Knab James Le
Bought by
Knab James E and Knab Janet S
Current Estimated Value
Purchase Details
Closed on
Dec 26, 2017
Sold by
Snyder Diana J
Bought by
Snyder Diana J and Snyder Knab Janet
Purchase Details
Closed on
Jun 30, 1995
Sold by
Goss David C
Bought by
Knab James E and Knab Janet S
Create a Home Valuation Report for This Property
The Home Valuation Report is an in-depth analysis detailing your home's value as well as a comparison with similar homes in the area
Home Values in the Area
Average Home Value in this Area
Purchase History
| Date | Buyer | Sale Price | Title Company |
|---|---|---|---|
| Knab James E | -- | None Available | |
| Snyder Diana J | -- | None Available | |
| Knab James E | $330,000 | -- |
Source: Public Records
Tax History
| Year | Tax Paid | Tax Assessment Tax Assessment Total Assessment is a certain percentage of the fair market value that is determined by local assessors to be the total taxable value of land and additions on the property. | Land | Improvement |
|---|---|---|---|---|
| 2025 | $13,473 | $232,720 | $82,600 | $150,120 |
| 2024 | $13,473 | $232,720 | $82,600 | $150,120 |
| 2023 | $13,306 | $232,720 | $82,600 | $150,120 |
| 2022 | $12,841 | $183,760 | $64,020 | $119,740 |
| 2021 | $11,367 | $183,760 | $64,020 | $119,740 |
| 2020 | $11,266 | $183,760 | $64,020 | $119,740 |
| 2019 | $11,274 | $162,580 | $64,020 | $98,560 |
| 2018 | $5,605 | $162,580 | $64,020 | $98,560 |
| 2017 | $11,187 | $162,580 | $64,020 | $98,560 |
| 2016 | $9,989 | $151,070 | $44,350 | $106,720 |
| 2015 | $4,990 | $151,070 | $44,350 | $106,720 |
| 2014 | $9,991 | $151,070 | $44,350 | $106,720 |
| 2013 | $4,771 | $137,340 | $40,320 | $97,020 |
Source: Public Records
Map
Nearby Homes
- 1165 Highland Dr
- 955 Amberly Place
- 1224 Kenbrook Hills Dr Unit 25
- 745 Highland Dr
- 936 Havendale Dr
- 4305 Castleton Rd
- 723 Drummond Ct
- 1121 Afton Rd
- 3336 Mansion Way
- 959 Caniff Place
- 1530 Pemberton Dr
- 4543 Ducrest Dr
- 3190 Kenny Rd
- 1512 Lafayette Dr Unit B
- 3701 Reed Rd
- 1094 Merrimar Cir S Unit A
- 1594 Lafayette Dr Unit 1594
- 4692 Charecote Ln Unit E
- 1046 Merrimar Cir N Unit I
- 1046 Merrimar Cir N Unit B
- 1110 Regency Dr
- 1140 Regency Dr
- 1119 Kingsdale Terrace
- 1129 Kingsdale Terrace
- 1160 Regency Dr
- 1135 Regency Dr
- 1119 Regency Dr
- 3881 Criswell Dr
- 1180 Regency Dr
- 1101 Kingsdale Terrace
- 1149 Regency Dr
- 3855 Criswell Dr
- 3909 Criswell Dr
- 1190 Regency Dr
- 1159 Regency Dr
- 3841 Criswell Dr
- 1179 Regency Dr
- 3925 Criswell Dr
- 1169 Regency Dr
- 1110 Kingsdale Terrace
Your Personal Tour Guide
Ask me questions while you tour the home.