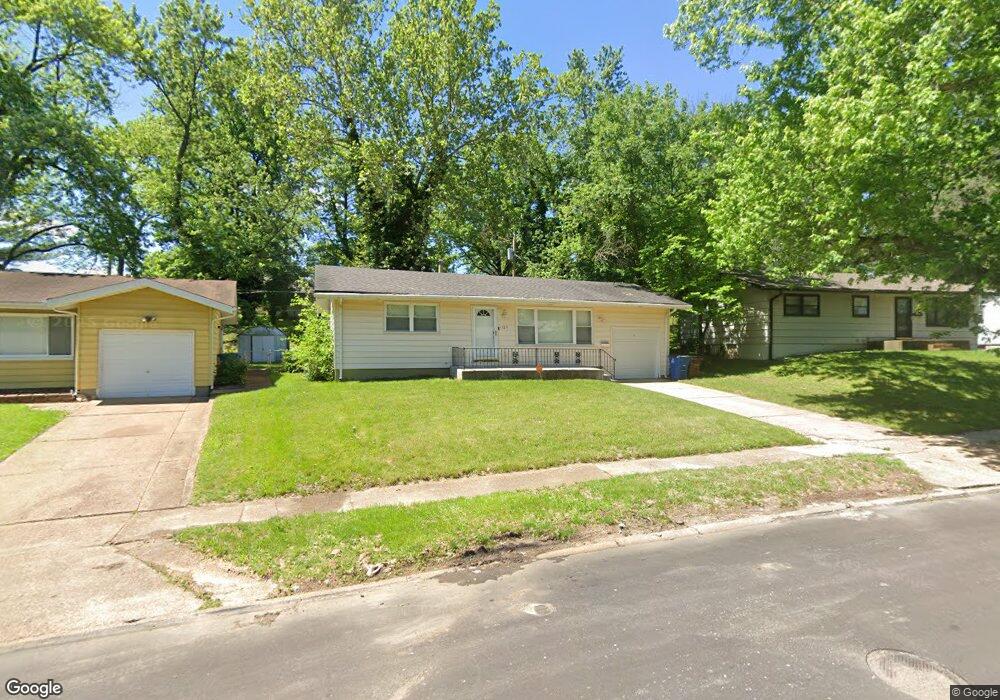
1120 Renshaw Dr Saint Louis, MO 63135
Estimated Value: $107,729 - $119,000
2
Beds
1
Bath
1,104
Sq Ft
$103/Sq Ft
Est. Value
About This Home
This home is located at 1120 Renshaw Dr, Saint Louis, MO 63135 and is currently estimated at $114,182, approximately $103 per square foot. 1120 Renshaw Dr is a home located in St. Louis County with nearby schools including Griffith Elementary School, Ferguson Middle School, and McCluer High School.
Ownership History
Date
Name
Owned For
Owner Type
Purchase Details
Closed on
Aug 29, 2002
Sold by
Boatman E L and Boatman Bertha Hadley
Bought by
Tousignant Calvin P and Tousignant Julia K
Current Estimated Value
Home Financials for this Owner
Home Financials are based on the most recent Mortgage that was taken out on this home.
Original Mortgage
$183,120
Interest Rate
6.31%
Mortgage Type
Purchase Money Mortgage
Purchase Details
Closed on
Jul 16, 1999
Sold by
Willis Donald K and Willis Lisa A
Bought by
Snider Youlanda R
Home Financials for this Owner
Home Financials are based on the most recent Mortgage that was taken out on this home.
Original Mortgage
$60,000
Interest Rate
7.68%
Purchase Details
Closed on
Oct 8, 1998
Sold by
Knowles James W and Knowles Patsy A
Bought by
Willis Donald K and Willis Lisa A
Home Financials for this Owner
Home Financials are based on the most recent Mortgage that was taken out on this home.
Original Mortgage
$51,000
Interest Rate
6.3%
Mortgage Type
Balloon
Create a Home Valuation Report for This Property
The Home Valuation Report is an in-depth analysis detailing your home's value as well as a comparison with similar homes in the area
Home Values in the Area
Average Home Value in this Area
Purchase History
| Date | Buyer | Sale Price | Title Company |
|---|---|---|---|
| Tousignant Calvin P | $228,900 | Capital Title | |
| Snider Youlanda R | $59,500 | -- | |
| Willis Donald K | $63,750 | U S Title Guaranty Company I |
Source: Public Records
Mortgage History
| Date | Status | Borrower | Loan Amount |
|---|---|---|---|
| Previous Owner | Tousignant Calvin P | $183,120 | |
| Previous Owner | Snider Youlanda R | $60,000 | |
| Previous Owner | Willis Donald K | $51,000 | |
| Closed | Willis Donald K | $12,750 | |
| Closed | Snider Youlanda R | $2,500 |
Source: Public Records
Tax History Compared to Growth
Tax History
| Year | Tax Paid | Tax Assessment Tax Assessment Total Assessment is a certain percentage of the fair market value that is determined by local assessors to be the total taxable value of land and additions on the property. | Land | Improvement |
|---|---|---|---|---|
| 2025 | $1,416 | $22,650 | $3,230 | $19,420 |
| 2024 | $1,416 | $19,480 | $2,890 | $16,590 |
| 2023 | $1,408 | $19,480 | $2,890 | $16,590 |
| 2022 | $1,086 | $13,020 | $3,710 | $9,310 |
| 2021 | $1,052 | $13,020 | $3,710 | $9,310 |
| 2020 | $1,047 | $11,650 | $2,050 | $9,600 |
| 2019 | $1,027 | $11,650 | $2,050 | $9,600 |
| 2018 | $921 | $9,290 | $2,470 | $6,820 |
| 2017 | $903 | $9,290 | $2,470 | $6,820 |
| 2016 | $1,238 | $12,640 | $2,470 | $10,170 |
| 2015 | $1,247 | $12,640 | $2,470 | $10,170 |
| 2014 | $1,107 | $11,070 | $2,390 | $8,680 |
Source: Public Records
Map
Nearby Homes
- 1108 Renshaw Dr
- 1006 Highmont Dr
- 125 Forestwood Dr
- 299 Dashwood Dr
- 50 Fenwick Dr
- 315 S Dellwood Dr
- 1321 Highmont Dr
- 49 S Dellwood Ave
- 33 S Schlueter Ave
- 57 Forestwood Dr
- 109 Florwood Ct
- 1325 Kappel Dr
- 1347 Kappel Dr
- 141 S Barat Ave
- 135 S Barat Ave
- 1304 Lang Dr
- 29 Godfrey Ln
- 324 Gage Dr
- 1330 Chambers Rd
- 1209 Chambers Rd
- 1116 Renshaw Dr
- 1124 Renshaw Dr
- 1121 Highmont Dr
- 1112 Renshaw Dr
- 1125 Highmont Dr
- 1128 Renshaw Dr
- 1129 Highmont Dr
- 1113 Highmont Dr
- 1123 Renshaw Dr
- 1119 Renshaw Dr
- 1129 Renshaw Dr
- 1133 Highmont Dr
- 1109 Highmont Dr
- 227 Forestwood Dr
- 1115 Renshaw Dr
- 1104 Renshaw Dr
- 1135 Renshaw Dr
- 1111 Renshaw Dr
- 1105 Highmont Dr
- 1137 Highmont Dr