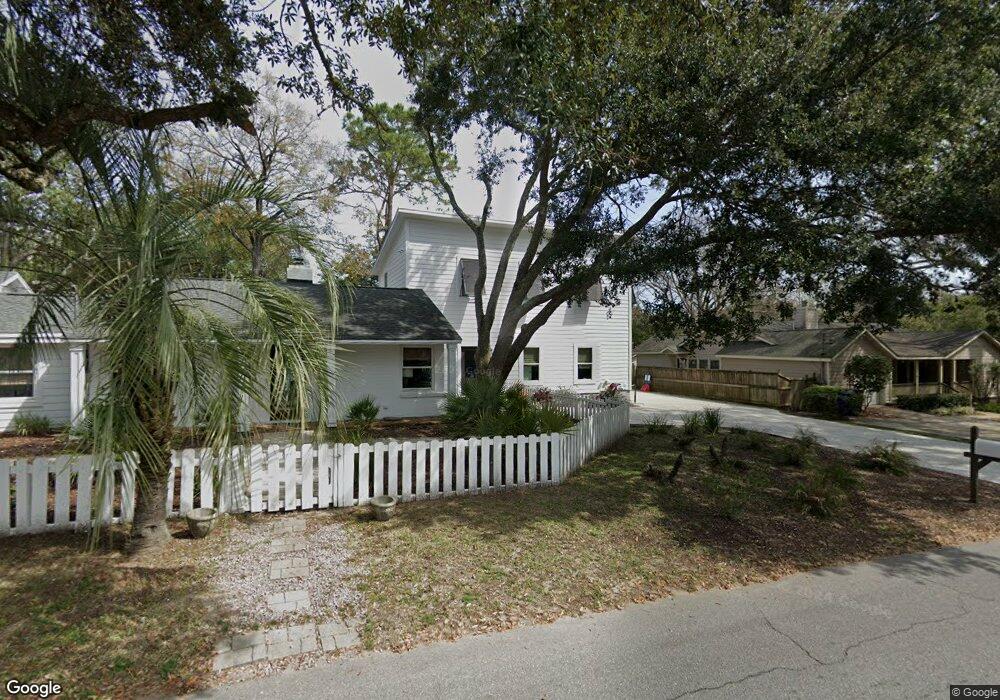
1120 Simmons St Mount Pleasant, SC 29464
Old Village NeighborhoodEstimated Value: $1,234,000 - $2,623,000
4
Beds
4
Baths
2,607
Sq Ft
$749/Sq Ft
Est. Value
About This Home
This home is located at 1120 Simmons St, Mount Pleasant, SC 29464 and is currently estimated at $1,952,619, approximately $748 per square foot. 1120 Simmons St is a home located in Charleston County with nearby schools including Mt. Pleasant Academy, Moultrie Middle School, and Lucy Garrett Beckham High School.
Ownership History
Date
Name
Owned For
Owner Type
Purchase Details
Closed on
Jun 6, 2014
Sold by
St Angela Llc
Bought by
Morris Elliott Shane and Morris Janie A
Current Estimated Value
Home Financials for this Owner
Home Financials are based on the most recent Mortgage that was taken out on this home.
Original Mortgage
$480,000
Outstanding Balance
$355,245
Interest Rate
3.5%
Mortgage Type
Construction
Estimated Equity
$1,597,374
Purchase Details
Closed on
May 22, 2013
Sold by
Myers Charles N and Myers Elizabeth M
Bought by
St Angela Llc
Purchase Details
Closed on
Jun 8, 2007
Sold by
Svencicki Susan Wall
Bought by
Myers Charles N and Myers Elizabeth M
Purchase Details
Closed on
May 20, 2005
Sold by
Svencicki Michael V
Bought by
Svencicki Susan Wall
Create a Home Valuation Report for This Property
The Home Valuation Report is an in-depth analysis detailing your home's value as well as a comparison with similar homes in the area
Home Values in the Area
Average Home Value in this Area
Purchase History
| Date | Buyer | Sale Price | Title Company |
|---|---|---|---|
| Morris Elliott Shane | $412,000 | -- | |
| St Angela Llc | $256,000 | -- | |
| Myers Charles N | $272,000 | None Available | |
| Svencicki Susan Wall | -- | -- |
Source: Public Records
Mortgage History
| Date | Status | Borrower | Loan Amount |
|---|---|---|---|
| Open | Morris Elliott Shane | $480,000 |
Source: Public Records
Tax History Compared to Growth
Tax History
| Year | Tax Paid | Tax Assessment Tax Assessment Total Assessment is a certain percentage of the fair market value that is determined by local assessors to be the total taxable value of land and additions on the property. | Land | Improvement |
|---|---|---|---|---|
| 2024 | $2,388 | $24,190 | $0 | $0 |
| 2023 | $2,388 | $24,190 | $0 | $0 |
| 2022 | $2,202 | $24,190 | $0 | $0 |
| 2021 | $2,425 | $24,190 | $0 | $0 |
| 2020 | $2,509 | $24,190 | $0 | $0 |
| 2019 | $2,185 | $21,040 | $0 | $0 |
| 2017 | $2,154 | $21,040 | $0 | $0 |
| 2016 | $2,048 | $21,040 | $0 | $0 |
| 2015 | $5,243 | $16,480 | $0 | $0 |
| 2014 | $3,253 | $0 | $0 | $0 |
| 2011 | -- | $0 | $0 | $0 |
Source: Public Records
Map
Nearby Homes
- 670 Poaug Ln
- 117 Freeman St
- 1489 Kinloch Ln
- 551 Klein St
- 558 Center St
- 517 Royall Ave
- 948 McCants Dr
- 1503 Ketch Ct
- 721 Royall Ave
- 731 Pitt St
- 1367 Pherigo St
- 208 Mccormick St
- 1520 Barquentine Dr
- 727 McCants Dr
- 521 London Bridge Rd
- 112 Middle St
- 657 Gate Post Dr
- 733 Atlantic St
- 301 Center St
- 242 Middle St