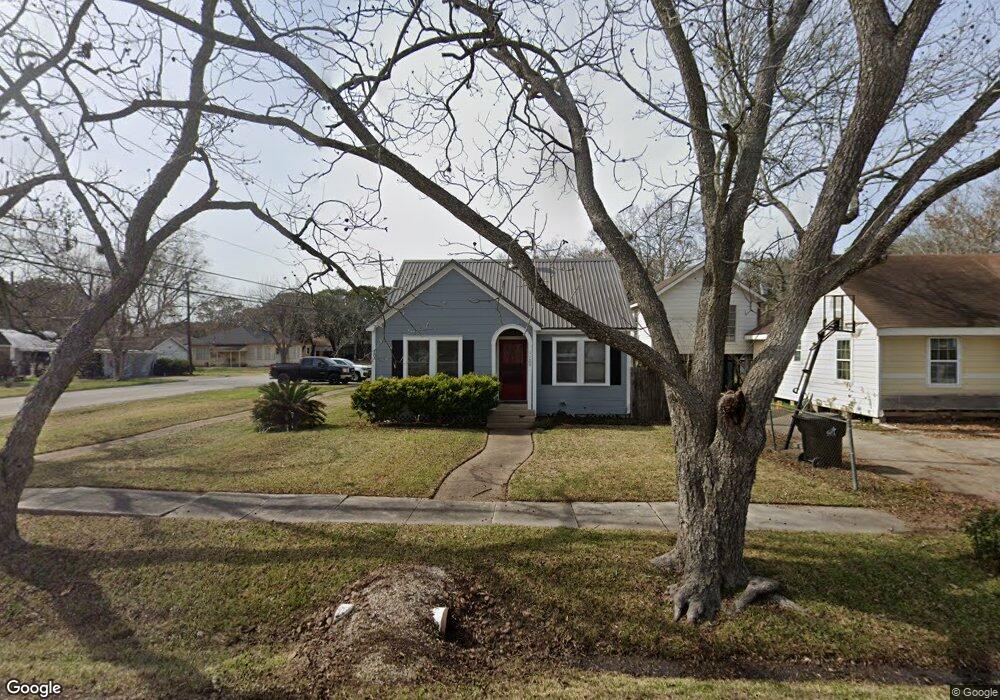
1120 Ward St Rosenberg, TX 77471
Estimated Value: $145,000 - $201,000
2
Beds
1
Bath
1,052
Sq Ft
$165/Sq Ft
Est. Value
About This Home
This home is located at 1120 Ward St, Rosenberg, TX 77471 and is currently estimated at $173,226, approximately $164 per square foot. 1120 Ward St is a home located in Fort Bend County with nearby schools including Travis Elementary School, Navarro Middle School, and George Junior High School.
Ownership History
Date
Name
Owned For
Owner Type
Purchase Details
Closed on
Aug 27, 2012
Sold by
Williams Susan
Bought by
Holderfield Kyle
Current Estimated Value
Home Financials for this Owner
Home Financials are based on the most recent Mortgage that was taken out on this home.
Original Mortgage
$76,007
Outstanding Balance
$52,095
Interest Rate
3.37%
Mortgage Type
FHA
Estimated Equity
$121,131
Purchase Details
Closed on
Mar 30, 2001
Sold by
H B Font Ltd
Bought by
Williams Susan
Home Financials for this Owner
Home Financials are based on the most recent Mortgage that was taken out on this home.
Original Mortgage
$50,825
Interest Rate
6.98%
Purchase Details
Closed on
Feb 24, 2000
Sold by
Font Henry B
Bought by
H B Font Ltd
Purchase Details
Closed on
Dec 8, 1988
Sold by
Broussard N E Mrs
Bought by
Holderfield Kyle
Create a Home Valuation Report for This Property
The Home Valuation Report is an in-depth analysis detailing your home's value as well as a comparison with similar homes in the area
Home Values in the Area
Average Home Value in this Area
Purchase History
| Date | Buyer | Sale Price | Title Company |
|---|---|---|---|
| Holderfield Kyle | -- | Stewart Title | |
| Williams Susan | -- | Startex Title Company | |
| H B Font Ltd | -- | -- | |
| Holderfield Kyle | -- | -- |
Source: Public Records
Mortgage History
| Date | Status | Borrower | Loan Amount |
|---|---|---|---|
| Open | Holderfield Kyle | $76,007 | |
| Previous Owner | Williams Susan | $50,825 |
Source: Public Records
Tax History Compared to Growth
Tax History
| Year | Tax Paid | Tax Assessment Tax Assessment Total Assessment is a certain percentage of the fair market value that is determined by local assessors to be the total taxable value of land and additions on the property. | Land | Improvement |
|---|---|---|---|---|
| 2025 | $964 | $118,864 | $60,073 | $58,791 |
| 2024 | $964 | $121,254 | $43,739 | $77,515 |
| 2023 | $807 | $110,231 | $30,648 | $79,583 |
| 2022 | $1,394 | $100,210 | $28,070 | $72,140 |
| 2021 | $1,890 | $91,100 | $42,530 | $48,570 |
| 2020 | $1,758 | $82,820 | $41,940 | $40,880 |
| 2019 | $1,720 | $75,290 | $25,700 | $49,590 |
| 2018 | $1,682 | $72,480 | $25,700 | $46,780 |
| 2017 | $1,656 | $70,960 | $25,700 | $45,260 |
| 2016 | $1,535 | $65,770 | $25,700 | $40,070 |
| 2015 | $1,122 | $66,390 | $25,700 | $40,690 |
| 2014 | $1,236 | $64,560 | $25,700 | $38,860 |
Source: Public Records
Map
Nearby Homes