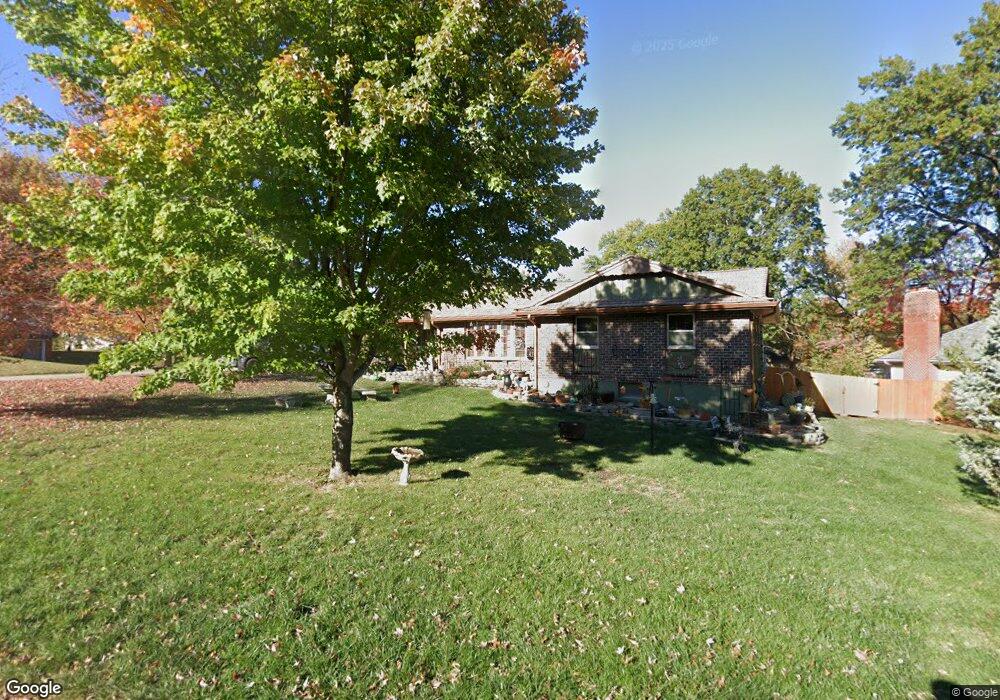
11200 E 64th St Raytown, MO 64133
Estimated Value: $192,000 - $264,000
3
Beds
4
Baths
2,099
Sq Ft
$109/Sq Ft
Est. Value
About This Home
This home is located at 11200 E 64th St, Raytown, MO 64133 and is currently estimated at $229,003, approximately $109 per square foot. 11200 E 64th St is a home located in Jackson County with nearby schools including Norfleet Elementary School, Raytown Central Middle School, and Raytown South High School.
Ownership History
Date
Name
Owned For
Owner Type
Purchase Details
Closed on
Sep 29, 2008
Sold by
Wells Fargo Bank Na
Bought by
Ruxlow Gregory C and Miles Ruxlow Mischelle
Current Estimated Value
Home Financials for this Owner
Home Financials are based on the most recent Mortgage that was taken out on this home.
Original Mortgage
$102,506
Outstanding Balance
$67,061
Interest Rate
6.18%
Mortgage Type
FHA
Estimated Equity
$161,942
Purchase Details
Closed on
Jun 10, 2008
Sold by
Hanna Rusty J and Hanna Debbie L
Bought by
Wells Fargo Bank Na and Asset Backed Pass Through Certificates S
Purchase Details
Closed on
Aug 1, 2000
Sold by
Umb Bank Trustee
Bought by
Caliguri Carole J
Home Financials for this Owner
Home Financials are based on the most recent Mortgage that was taken out on this home.
Original Mortgage
$102,000
Interest Rate
8.22%
Mortgage Type
Purchase Money Mortgage
Create a Home Valuation Report for This Property
The Home Valuation Report is an in-depth analysis detailing your home's value as well as a comparison with similar homes in the area
Home Values in the Area
Average Home Value in this Area
Purchase History
| Date | Buyer | Sale Price | Title Company |
|---|---|---|---|
| Ruxlow Gregory C | -- | Mokan Title Services Llc | |
| Wells Fargo Bank Na | $144,223 | Mo Kan Title Services Inc | |
| Caliguri Carole J | -- | Ati Title Company |
Source: Public Records
Mortgage History
| Date | Status | Borrower | Loan Amount |
|---|---|---|---|
| Open | Ruxlow Gregory C | $102,506 | |
| Previous Owner | Caliguri Carole J | $102,000 |
Source: Public Records
Tax History
| Year | Tax Paid | Tax Assessment Tax Assessment Total Assessment is a certain percentage of the fair market value that is determined by local assessors to be the total taxable value of land and additions on the property. | Land | Improvement |
|---|---|---|---|---|
| 2025 | $473 | $6,031 | $5,634 | $397 |
| 2024 | $470 | $5,244 | $1,799 | $3,445 |
| 2023 | $470 | $5,244 | $1,594 | $3,650 |
| 2022 | $3,038 | $32,300 | $3,724 | $28,576 |
| 2021 | $3,049 | $32,300 | $3,724 | $28,576 |
| 2020 | $2,800 | $29,383 | $3,724 | $25,659 |
| 2019 | $2,785 | $29,383 | $3,724 | $25,659 |
| 2018 | $2,341 | $25,573 | $3,241 | $22,332 |
| 2016 | $2,269 | $24,932 | $4,305 | $20,627 |
Source: Public Records
Map
Nearby Homes
- 6506 Sterling Ave
- 11408 E 65th Terrace
- 6322 Norwood Ct
- 11601 E 62nd St
- 11213 E 61st St
- 6100 Englewood Ave
- 6207 Hedges Ave
- 6621 Woodson Rd
- 10909 E 60th Terrace
- 5933 Sterling Ave
- 6121 Willow Ave
- 6208 Willow Ave
- 6817 Englewood Ave
- 6603 Hardy Ave
- 6817 Lakeshore Dr
- 6828 Vermont Ave
- 10905 E 59th St
- 5813 Harvard Ave
- 6126 Ash Ct
- 7007 Lakeshore Dr
- 11204 E 64th St
- 6317 Sterling Ave
- 6313 Sterling Ave
- 6328 Sterling Ave
- 6324 Sterling Ave
- 11201 E 64th St
- 11208 E 64th St
- 6332 Sterling Ave
- 11205 E 64th St
- 6400 Sterling Ave
- 6320 Sterling Ave
- 6309 Sterling Ave
- 6316 Sterling Ave
- 11209 E 64th St
- 11212 E 64th St
- 11200 E 64th Terrace
- 6312 Sterling Ave
- 6404 Sterling Ave
- 11204 E 64th Terrace
- 6401 Harvard Ave
Your Personal Tour Guide
Ask me questions while you tour the home.