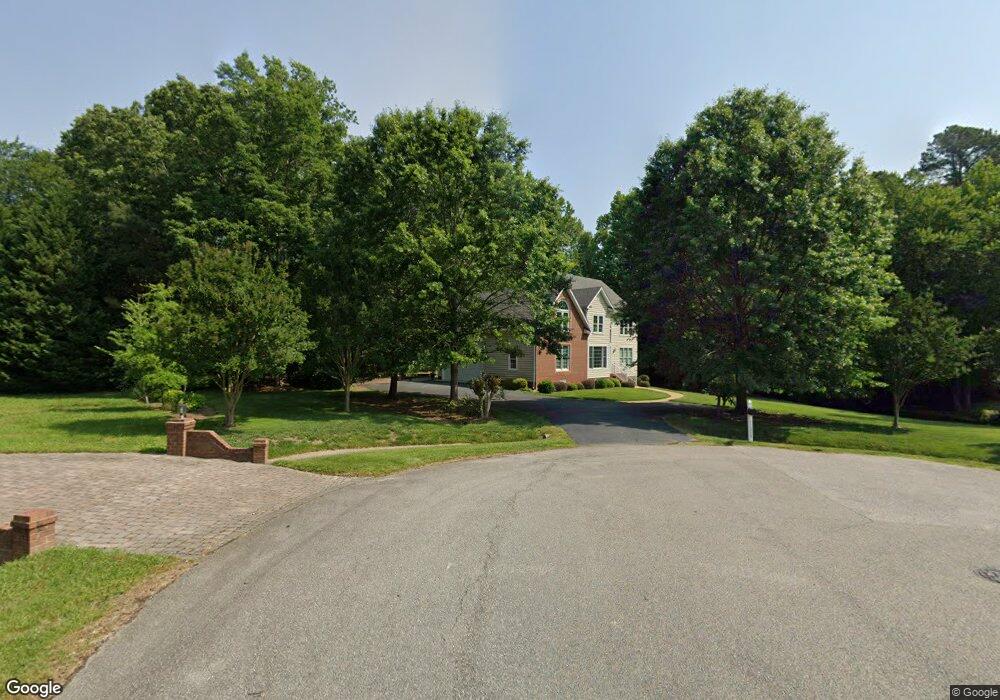
11200 Old Lewiston Rd North Chesterfield, VA 23236
Estimated Value: $569,589 - $648,000
5
Beds
3
Baths
3,184
Sq Ft
$191/Sq Ft
Est. Value
About This Home
This home is located at 11200 Old Lewiston Rd, North Chesterfield, VA 23236 and is currently estimated at $609,647, approximately $191 per square foot. 11200 Old Lewiston Rd is a home located in Chesterfield County with nearby schools including W W Gordon Elementary School, Midlothian Middle School, and Monacan High School.
Ownership History
Date
Name
Owned For
Owner Type
Purchase Details
Closed on
Apr 23, 2021
Sold by
Kerner Carla D and Kerner Thomas E
Bought by
Myhre Pemela and Myhre Graham Paul
Current Estimated Value
Home Financials for this Owner
Home Financials are based on the most recent Mortgage that was taken out on this home.
Original Mortgage
$388,260
Outstanding Balance
$351,112
Interest Rate
3.1%
Mortgage Type
New Conventional
Estimated Equity
$258,535
Purchase Details
Closed on
Sep 10, 1999
Sold by
Durrett Eloise S
Bought by
Jfeerson David L
Purchase Details
Closed on
Oct 1, 1997
Sold by
G Wilson I A
Bought by
Jefferson David L
Home Financials for this Owner
Home Financials are based on the most recent Mortgage that was taken out on this home.
Original Mortgage
$100,000
Interest Rate
7.41%
Create a Home Valuation Report for This Property
The Home Valuation Report is an in-depth analysis detailing your home's value as well as a comparison with similar homes in the area
Home Values in the Area
Average Home Value in this Area
Purchase History
| Date | Buyer | Sale Price | Title Company |
|---|---|---|---|
| Myhre Pemela | $488,260 | Attorney | |
| Jfeerson David L | $12,500 | -- | |
| Jefferson David L | $175,000 | -- | |
| A G Wilson Inc | $40,000 | -- |
Source: Public Records
Mortgage History
| Date | Status | Borrower | Loan Amount |
|---|---|---|---|
| Open | Myhre Pemela | $388,260 | |
| Previous Owner | A G Wilson Inc | $100,000 |
Source: Public Records
Tax History Compared to Growth
Tax History
| Year | Tax Paid | Tax Assessment Tax Assessment Total Assessment is a certain percentage of the fair market value that is determined by local assessors to be the total taxable value of land and additions on the property. | Land | Improvement |
|---|---|---|---|---|
| 2025 | $4,476 | $500,100 | $85,000 | $415,100 |
| 2024 | $4,476 | $492,800 | $79,000 | $413,800 |
| 2023 | $4,321 | $474,800 | $76,000 | $398,800 |
| 2022 | $3,949 | $429,200 | $72,000 | $357,200 |
| 2021 | $3,844 | $397,700 | $70,000 | $327,700 |
| 2020 | $3,581 | $376,900 | $70,000 | $306,900 |
| 2019 | $3,475 | $365,800 | $70,000 | $295,800 |
| 2018 | $3,315 | $348,900 | $68,000 | $280,900 |
| 2017 | $3,187 | $332,000 | $68,000 | $264,000 |
| 2016 | $3,171 | $330,300 | $70,000 | $260,300 |
| 2015 | $3,181 | $328,800 | $70,000 | $258,800 |
| 2014 | $3,144 | $324,900 | $70,000 | $254,900 |
Source: Public Records
Map
Nearby Homes
- 11603 Durrington Dr
- 11312 McCauliff Ct
- 149 N Courthouse Rd
- 11506 Glenmont Rd
- 11520 Old Carrollton Ct
- 11761 Edenberry Dr
- 11009 Lantern Way
- 1002 Wedgemont Place
- 11205 Lantern Way Unit B
- 10500 Royal Cresent Way
- 121 Avebury Dr
- 10324 Natural Bridge Rd
- 811 Clearlake Rd
- 11301 Mansfield Crossing Ct
- 11950 Lucks Ln
- 11625 Nevis Dr
- 11960 Lucks Ln
- 11970 Lucks Ln
- 32 Mistywood Rd
- 11151 Research Plaza Way
- 11219 Bondurant Dr
- 11204 Old Lewiston Rd
- 11213 Bondurant Dr
- 11211 Old Lewiston Rd
- 11301 Bondurant Dr
- 11207 Bondurant Dr
- 249 Twin Crest Dr
- 11309 Bondurant Dr
- 11220 Bondurant Dr
- 11210 Old Lewiston Rd
- 11221 Old Lewiston Rd
- 243 Twin Crest Dr
- 11201 Bondurant Dr
- 11212 Bondurant Dr
- 11224 Bondurant Dr
- 11319 Bondurant Dr
- 11220 Old Lewiston Rd
- 11201 Hixson Ct
- 11231 Old Lewiston Rd
- 207 Hixson Dr