11201 Bonham Ranch Rd Unit 9 Dripping Springs, TX 78620
Hamilton Pool NeighborhoodEstimated Value: $1,551,000 - $1,787,054
6
Beds
5
Baths
4,347
Sq Ft
$387/Sq Ft
Est. Value
About This Home
This home is located at 11201 Bonham Ranch Rd Unit 9, Dripping Springs, TX 78620 and is currently estimated at $1,681,018, approximately $386 per square foot. 11201 Bonham Ranch Rd Unit 9 is a home located in Travis County with nearby schools including Bee Cave Elementary School, Bee Cave Middle School, and Lake Travis High School.
Ownership History
Date
Name
Owned For
Owner Type
Purchase Details
Closed on
Jun 25, 2025
Sold by
Burggraaf David and Burggraaf Jennifer
Bought by
Troup Jacob Evans Trust and Agness
Current Estimated Value
Purchase Details
Closed on
Oct 19, 2018
Sold by
Swan Jerry and Swan Italia Shar
Bought by
Burggraaf David and Burggraaf Jennifer
Home Financials for this Owner
Home Financials are based on the most recent Mortgage that was taken out on this home.
Original Mortgage
$691,200
Interest Rate
4.5%
Mortgage Type
Purchase Money Mortgage
Purchase Details
Closed on
Jul 18, 2006
Sold by
Byington Russell C and Byington Eva P
Bought by
Russell C & Eva P Byington Revocable Tru
Purchase Details
Closed on
Oct 24, 2005
Sold by
Bonham Donald James and Bonham Donnie Wayne
Bought by
Swan Jerry and Swan Italia Shar
Home Financials for this Owner
Home Financials are based on the most recent Mortgage that was taken out on this home.
Original Mortgage
$120,120
Interest Rate
5.87%
Mortgage Type
Balloon
Create a Home Valuation Report for This Property
The Home Valuation Report is an in-depth analysis detailing your home's value as well as a comparison with similar homes in the area
Home Values in the Area
Average Home Value in this Area
Purchase History
| Date | Buyer | Sale Price | Title Company |
|---|---|---|---|
| Troup Jacob Evans Trust | -- | Independence Title | |
| Burggraaf David | -- | Alamo Title Co | |
| Russell C & Eva P Byington Revocable Tru | -- | None Available | |
| Swan Jerry | -- | -- |
Source: Public Records
Mortgage History
| Date | Status | Borrower | Loan Amount |
|---|---|---|---|
| Previous Owner | Burggraaf David | $691,200 | |
| Previous Owner | Swan Jerry | $120,120 |
Source: Public Records
Tax History Compared to Growth
Tax History
| Year | Tax Paid | Tax Assessment Tax Assessment Total Assessment is a certain percentage of the fair market value that is determined by local assessors to be the total taxable value of land and additions on the property. | Land | Improvement |
|---|---|---|---|---|
| 2025 | $11,497 | $1,236,872 | -- | -- |
| 2023 | $11,497 | $1,022,208 | $0 | $0 |
| 2022 | $15,944 | $929,280 | $0 | $0 |
| 2021 | $13,639 | $844,800 | $350,150 | $843,260 |
| 2020 | $13,347 | $768,000 | $200,200 | $567,800 |
| 2018 | $11,838 | $666,799 | $200,200 | $466,599 |
| 2017 | $11,854 | $661,722 | $200,200 | $466,254 |
| 2016 | $11,131 | $601,565 | $130,130 | $471,435 |
| 2015 | $7,780 | $567,932 | $130,130 | $476,616 |
| 2014 | $7,780 | $516,302 | $130,130 | $386,172 |
Source: Public Records
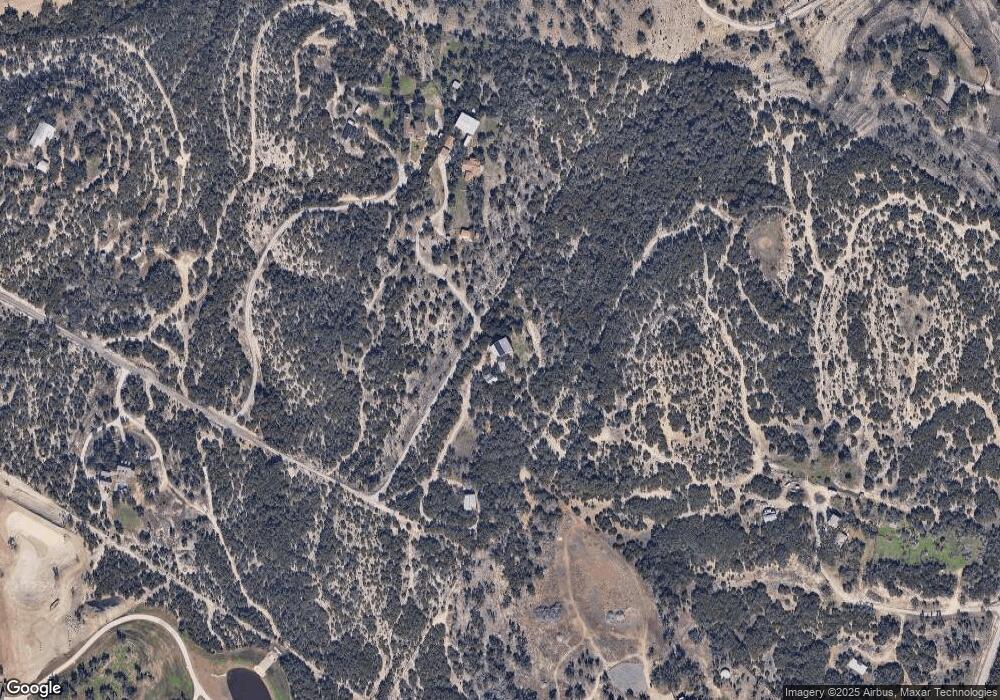
Map
Nearby Homes
- 11134 Bonham Ranch Rd
- 11155 Bonham Ranch Rd
- 499 Hannah Dr
- 255 Patti Ln
- 11904 Fitzhugh Corners
- 12225 Triple Creek Cir
- 10802 & 10804 Timber Cir
- 12303 Triple Creek Cir
- 17201 Oak Cliff Cir
- 12304 Triple Creek Cir
- 17110 Oak Cliff Cir
- 12341 Triple Creek Cir
- 101 Twin Creek Rd
- 17621 Panorama Dr
- 10806 Glenview Cir
- 12310 Triple Creek Dr
- 15000 Fitzhugh Rd
- Lot A (Subdivided) Mirela Ann Rd
- Lot D (Subdivided) Mirela Ann Rd
- Lot G (Subdivided) Mirela Ann Rd
- 11201 Bonham Ranch Rd Unit 15
- 11201 Bonham Ranch Rd Unit 9
- 11201 Bonham Ranch Rd
- 11201 Bonham Ranch Rd Unit 12
- 11201 Bonham Ranch Rd Unit 10
- 11201 Bonham Ranch Rd Unit 14
- 11201 Bonham Ranch Rd Unit 6 and 8
- 11201 Bonham Ranch Rd Unit 6 and 8
- 11201 Bonham Ranch Rd Unit 10
- 11201 Bonham Ranch Rd Unit 15
- 11205 Bonham Ranch Rd
- 11355 Bonham Ranch Rd Unit 4
- 11355 Bonham Ranch Rd Unit C
- 11355 Bonham Ranch Rd Unit B
- 11355 Bonham Ranch Rd
- 11250 Bonham Ranch Rd
- 11391 Bonham Ranch Rd
- 11161 Bonham Ranch Rd
- 11211 Bonham Ranch Rd
- 11190 Bonham Ranch Rd