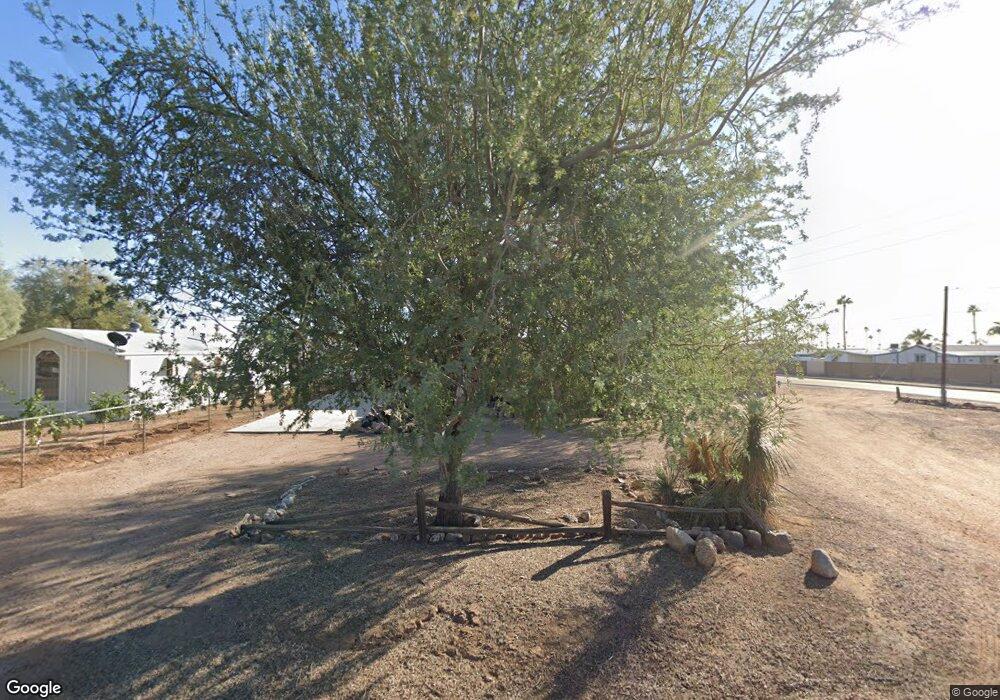
11201 E Mercury Dr Apache Junction, AZ 85120
Northeast Mesa NeighborhoodEstimated Value: $228,000 - $309,000
2
Beds
2
Baths
960
Sq Ft
$271/Sq Ft
Est. Value
About This Home
This home is located at 11201 E Mercury Dr, Apache Junction, AZ 85120 and is currently estimated at $260,635, approximately $271 per square foot. 11201 E Mercury Dr is a home located in Maricopa County with nearby schools including Sousa Elementary School, Franklin at Brimhall Elementary School, and Franklin West Elementary School.
Ownership History
Date
Name
Owned For
Owner Type
Purchase Details
Closed on
Dec 26, 2014
Sold by
Walker Fred L and Walker Sabrina S
Bought by
Walker Brian
Current Estimated Value
Home Financials for this Owner
Home Financials are based on the most recent Mortgage that was taken out on this home.
Original Mortgage
$79,000
Outstanding Balance
$60,777
Interest Rate
3.96%
Mortgage Type
Seller Take Back
Estimated Equity
$199,858
Purchase Details
Closed on
Apr 9, 2010
Sold by
Thorsted Robert John
Bought by
Federal National Mortgage Association
Purchase Details
Closed on
Jun 13, 2002
Sold by
Khan Azam M
Bought by
N A Legal Consultants Llc
Create a Home Valuation Report for This Property
The Home Valuation Report is an in-depth analysis detailing your home's value as well as a comparison with similar homes in the area
Home Values in the Area
Average Home Value in this Area
Purchase History
| Date | Buyer | Sale Price | Title Company |
|---|---|---|---|
| Walker Brian | $80,000 | Security Title Agency | |
| Federal National Mortgage Association | $167,939 | Great American Title Agency | |
| N A Legal Consultants Llc | -- | -- |
Source: Public Records
Mortgage History
| Date | Status | Borrower | Loan Amount |
|---|---|---|---|
| Open | Walker Brian | $79,000 |
Source: Public Records
Tax History
| Year | Tax Paid | Tax Assessment Tax Assessment Total Assessment is a certain percentage of the fair market value that is determined by local assessors to be the total taxable value of land and additions on the property. | Land | Improvement |
|---|---|---|---|---|
| 2025 | $455 | $6,106 | -- | -- |
| 2024 | $465 | $5,815 | -- | -- |
| 2023 | $465 | $21,410 | $4,280 | $17,130 |
| 2022 | $453 | $15,350 | $3,070 | $12,280 |
| 2021 | $458 | $12,580 | $2,510 | $10,070 |
| 2020 | $455 | $11,010 | $2,200 | $8,810 |
| 2019 | $417 | $9,600 | $1,920 | $7,680 |
| 2018 | $405 | $7,280 | $1,450 | $5,830 |
| 2017 | $390 | $6,330 | $1,260 | $5,070 |
| 2016 | $382 | $5,630 | $1,120 | $4,510 |
| 2015 | $358 | $4,280 | $850 | $3,430 |
Source: Public Records
Map
Nearby Homes
- 11201 E Jupiter Dr
- 11252 E Boise St
- 53 N Mountain Rd Unit 75
- 433 N 111th Place
- 11100 E Apache Trail Unit 37
- 11100 E Apache Trail
- 11100 E Apache Trail Unit 8
- 11100 E Apache Trail Unit 16
- 11100 E Apache Trail Unit 48
- 456 N Opal
- 11425 E University Dr Unit 114
- 11425 E University Dr Unit 57
- 11425 E University Dr Unit 49
- 11425 E University Dr Unit 124
- 11340 E Caballero St
- 10936 E Apache Trail Unit 121
- 11465 E Cicero St Unit I
- 11066 E Abilene Ave
- 11058 E Cholla Rd
- 538 N 110th St
- 11209 E Mercury Dr
- 11202 E Boulder Dr
- 11206 E Boulder Dr
- 11219 E Mercury Dr
- 11212 E Boulder Dr
- 11220 E Mercury Dr
- 11227 E Mercury Dr
- 11222 E Mercury Dr
- 221 N Mountain Rd
- 11228 E Boulder Dr
- 11207 E Boulder Dr
- 11207 E Boulder Dr
- 11209 E Jupiter Dr
- 11237 E Mercury Dr
- 11219 E Boulder Dr
- 11219 E Jupiter Dr
- 11238 E Boulder Dr
- 11238 E Mercury Dr
- 11245 E Mercury Dr
- 11246 E Boulder Dr
Your Personal Tour Guide
Ask me questions while you tour the home.