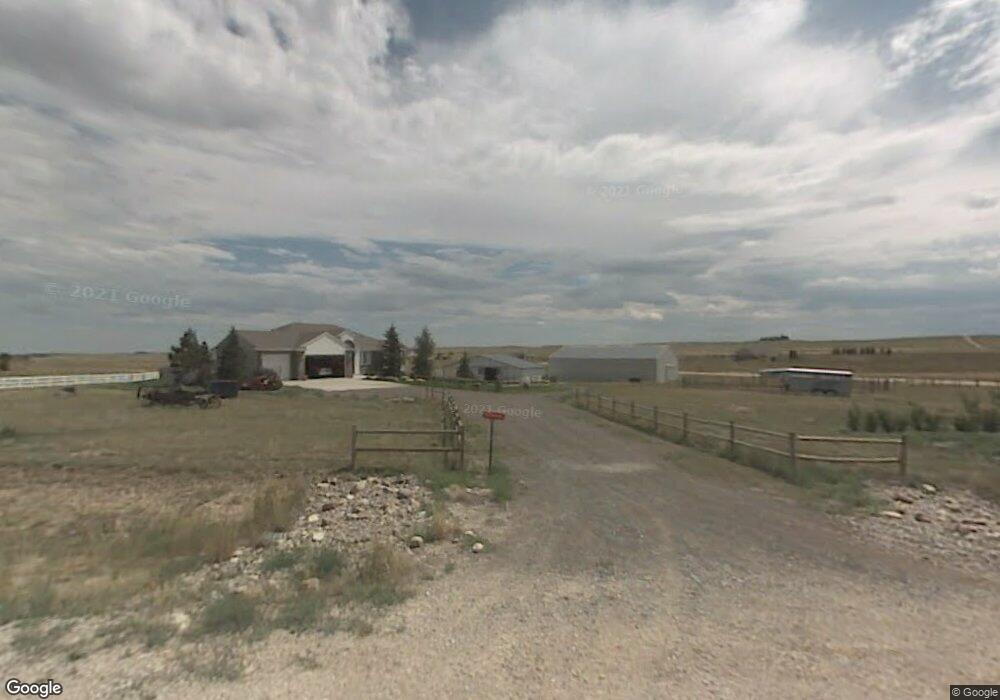
11207 Doc Holliday Loop Cheyenne, WY 82009
Ranchettes NeighborhoodEstimated Value: $522,000 - $754,610
--
Bed
--
Bath
1,764
Sq Ft
$362/Sq Ft
Est. Value
About This Home
This home is located at 11207 Doc Holliday Loop, Cheyenne, WY 82009 and is currently estimated at $638,305, approximately $361 per square foot. 11207 Doc Holliday Loop is a home with nearby schools including Prairie Wind Elementary School, McCormick Junior High School, and Central High School.
Ownership History
Date
Name
Owned For
Owner Type
Purchase Details
Closed on
Apr 18, 2017
Sold by
Verney Lena H
Bought by
Lena H Verney 1999 Revocable Trust
Current Estimated Value
Purchase Details
Closed on
Mar 20, 2017
Sold by
Varney Lena H
Bought by
Dean R Verney Family Trust
Purchase Details
Closed on
Mar 30, 2006
Sold by
Rhoades Dana E
Bought by
Varney Dean R
Purchase Details
Closed on
Feb 27, 2003
Sold by
Wanamaker Michelle L
Bought by
Rhoades Dana E
Home Financials for this Owner
Home Financials are based on the most recent Mortgage that was taken out on this home.
Original Mortgage
$109,569
Interest Rate
5.93%
Mortgage Type
Commercial
Purchase Details
Closed on
Apr 28, 2000
Sold by
Consolidated Construction Inc
Bought by
Wanamaker Bret C and Wanamaker Michelle L
Home Financials for this Owner
Home Financials are based on the most recent Mortgage that was taken out on this home.
Original Mortgage
$203,000
Interest Rate
8.21%
Mortgage Type
Commercial
Create a Home Valuation Report for This Property
The Home Valuation Report is an in-depth analysis detailing your home's value as well as a comparison with similar homes in the area
Home Values in the Area
Average Home Value in this Area
Purchase History
| Date | Buyer | Sale Price | Title Company |
|---|---|---|---|
| Lena H Verney 1999 Revocable Trust | -- | None Available | |
| Dean R Verney Family Trust | -- | None Available | |
| Varney Dean R | -- | Summit Title Services | |
| Rhoades Dana E | -- | -- | |
| Wanamaker Bret C | -- | -- |
Source: Public Records
Mortgage History
| Date | Status | Borrower | Loan Amount |
|---|---|---|---|
| Previous Owner | Rhoades Dana E | $109,569 | |
| Previous Owner | Wanamaker Bret C | $203,000 |
Source: Public Records
Tax History Compared to Growth
Tax History
| Year | Tax Paid | Tax Assessment Tax Assessment Total Assessment is a certain percentage of the fair market value that is determined by local assessors to be the total taxable value of land and additions on the property. | Land | Improvement |
|---|---|---|---|---|
| 2025 | $4,296 | $34,826 | $8,466 | $26,360 |
| 2024 | $4,296 | $66,915 | $16,932 | $49,983 |
| 2023 | $3,821 | $61,145 | $12,646 | $48,499 |
| 2022 | $3,133 | $49,630 | $8,431 | $41,199 |
| 2021 | $2,933 | $46,554 | $8,044 | $38,510 |
| 2020 | $2,855 | $45,523 | $7,261 | $38,262 |
| 2019 | $2,816 | $44,902 | $7,261 | $37,641 |
| 2018 | $2,719 | $43,877 | $7,261 | $36,616 |
| 2017 | $2,732 | $43,672 | $7,261 | $36,411 |
| 2016 | $2,693 | $43,068 | $6,614 | $36,454 |
| 2015 | $2,664 | $42,626 | $6,614 | $36,012 |
| 2014 | $2,663 | $42,342 | $6,614 | $35,728 |
Source: Public Records
Map
Nearby Homes
- 4704 Horse Creek Rd
- TBD Horse Creek Rd
- Tract 110 T Lazy T Ct
- Tract 109 T Lazy T Ct
- Tract 113 T Lazy T Ct
- Tract 108 T Lazy T Ct
- Tract 107 T Lazy T Ct
- Tract 114 T Lazy T Ct
- 11808 Three Dots Trail
- TBD Klipstein Rd
- Tract 115 T Lazy T Ct
- Tract 117 Figure 4 Ct
- 2900 Three Dots Trail
- Tract 103 T Lazy T Ct
- 3110 Wineglass Rd
- Tract 118 Figure 4 Ct
- Tract 102 T Lazy T Ct
- Lot 17 Foxhill Rd
- Lot 18 Foxhill Rd
- Tract 88 Lazy Ct E
- 0 Tom Horn Trail Unit 60558
- 11105 Tom Horn Trail
- 11219 Doc Holliday Loop
- 4379 Butch Cassidy Trail
- 11300 Doc Holliday Loop
- 11311 Doc Holliday Loop
- 4490 Butch Cassidy Trail
- 11004 Tom Horn Trail
- 11345 Doc Holliday Loop
- 11447 Doc Holliday Loop
- 4489 Butch Cassidy Trail
- 4604 Horse Creek Rd
- 4614 Horse Creek Rd
- 3781 Butch Cassidy Trail
- 4380 Butch Cassidy Trail
- 4380 Butch Cassidy Trail
- 11001 Tom Horn Trail
- 3721 Butch Cassidy Trail
- 4010 Horse Creek Rd
- 3817 Butch Cassidy Trail