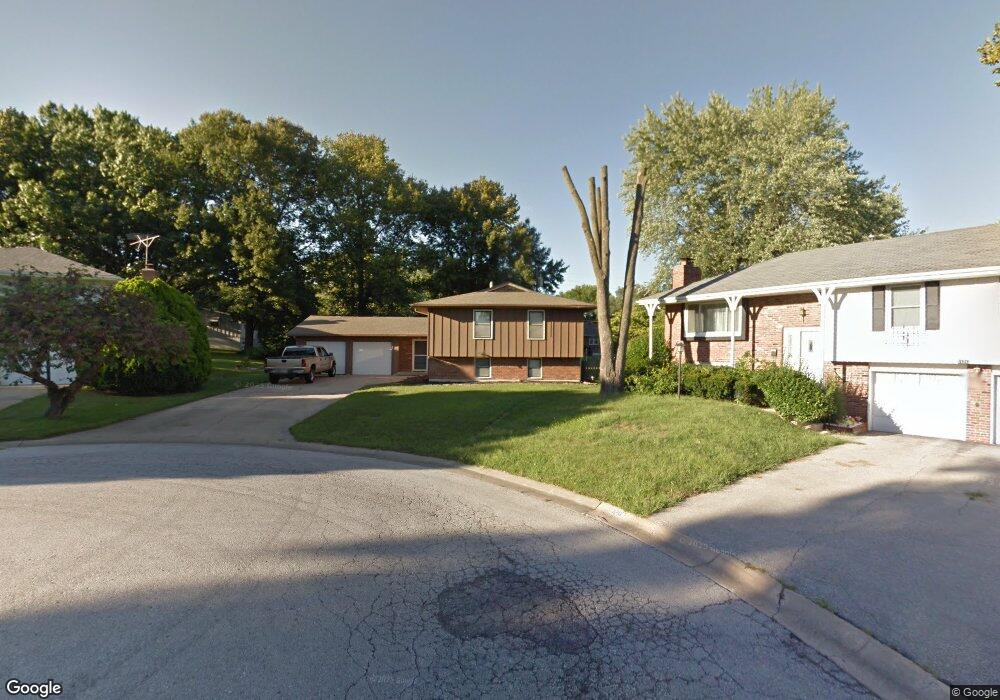
11208 E 59th Terrace Raytown, MO 64133
Estimated Value: $232,000 - $257,000
3
Beds
2
Baths
1,372
Sq Ft
$176/Sq Ft
Est. Value
About This Home
This home is located at 11208 E 59th Terrace, Raytown, MO 64133 and is currently estimated at $241,103, approximately $175 per square foot. 11208 E 59th Terrace is a home located in Jackson County with nearby schools including Norfleet Elementary School, Raytown Central Middle School, and Raytown South High School.
Ownership History
Date
Name
Owned For
Owner Type
Purchase Details
Closed on
Apr 27, 2007
Sold by
Miller Jason Thomas and Meyer Lorinda M
Bought by
Duncan Christopher L
Current Estimated Value
Home Financials for this Owner
Home Financials are based on the most recent Mortgage that was taken out on this home.
Original Mortgage
$118,044
Outstanding Balance
$71,294
Interest Rate
6.13%
Mortgage Type
FHA
Estimated Equity
$169,809
Purchase Details
Closed on
Dec 10, 2001
Sold by
Hughes Christine
Bought by
Miller Lisa A
Home Financials for this Owner
Home Financials are based on the most recent Mortgage that was taken out on this home.
Original Mortgage
$78,000
Interest Rate
6.52%
Mortgage Type
Purchase Money Mortgage
Purchase Details
Closed on
May 21, 1996
Sold by
Hughes Christine and Springer Louis A
Bought by
Hughes Christine
Home Financials for this Owner
Home Financials are based on the most recent Mortgage that was taken out on this home.
Original Mortgage
$54,000
Interest Rate
8.06%
Mortgage Type
Purchase Money Mortgage
Create a Home Valuation Report for This Property
The Home Valuation Report is an in-depth analysis detailing your home's value as well as a comparison with similar homes in the area
Home Values in the Area
Average Home Value in this Area
Purchase History
| Date | Buyer | Sale Price | Title Company |
|---|---|---|---|
| Duncan Christopher L | -- | Heart Of America Title & Esc | |
| Miller Lisa A | -- | Old Republic Title Company | |
| Hughes Christine | -- | -- |
Source: Public Records
Mortgage History
| Date | Status | Borrower | Loan Amount |
|---|---|---|---|
| Open | Duncan Christopher L | $118,044 | |
| Previous Owner | Miller Lisa A | $78,000 | |
| Previous Owner | Hughes Christine | $54,000 |
Source: Public Records
Tax History Compared to Growth
Tax History
| Year | Tax Paid | Tax Assessment Tax Assessment Total Assessment is a certain percentage of the fair market value that is determined by local assessors to be the total taxable value of land and additions on the property. | Land | Improvement |
|---|---|---|---|---|
| 2025 | $3,179 | $27,639 | $5,054 | $22,585 |
| 2024 | $3,158 | $35,241 | $3,025 | $32,216 |
| 2023 | $3,158 | $35,241 | $2,170 | $33,071 |
| 2022 | $1,966 | $20,900 | $3,943 | $16,957 |
| 2021 | $1,973 | $20,900 | $3,943 | $16,957 |
| 2020 | $1,894 | $19,877 | $3,943 | $15,934 |
| 2019 | $1,884 | $19,877 | $3,943 | $15,934 |
| 2018 | $1,713 | $18,716 | $4,594 | $14,122 |
| 2017 | $1,672 | $18,716 | $4,594 | $14,122 |
| 2016 | $1,672 | $18,376 | $2,544 | $15,832 |
| 2014 | $1,642 | $17,841 | $2,470 | $15,371 |
Source: Public Records
Map
Nearby Homes
- 11312 E 59th St
- 5933 Sterling Ave
- 6004 S Claremont Ave
- 5828 Woodson Rd
- 11500 E 58th St
- 5801 Appleton Ave
- 6100 Englewood Ave
- 10909 E 60th Terrace
- 11707 E 60th Terrace
- 11715 E 60th St
- 11701 E 61st St
- 11914 E 59th Terrace
- 10906 E 62nd Terrace
- 10608 E 59th St
- 11600 E 62nd St
- 11918 E 59th St
- 5621 Ridgeway Ave
- 11601 E 62nd St
- 6207 Hedges Ave
- 11913 E 57th St
- 11209 E 59th St
- 11212 E 59th Terrace
- 11204 E 59th Terrace
- 11213 E 59th St
- 11205 E 59th St
- 11200 E 59th Terrace
- 11213 E 59th Terrace
- 11201 E 59th St
- 11205 E 59th Terrace
- 11201 E 59th Terrace
- 11209 E 59th Terrace
- 11216 E 59th St
- 5906 Claremont Ave
- 11223 E 59th St
- 11220 E 59th St
- 5904 Claremont Ave
- 5908 Claremont Ave
- 5921 Sterling Ave
- 0 E 59th St
- 5908 Sterling Ave