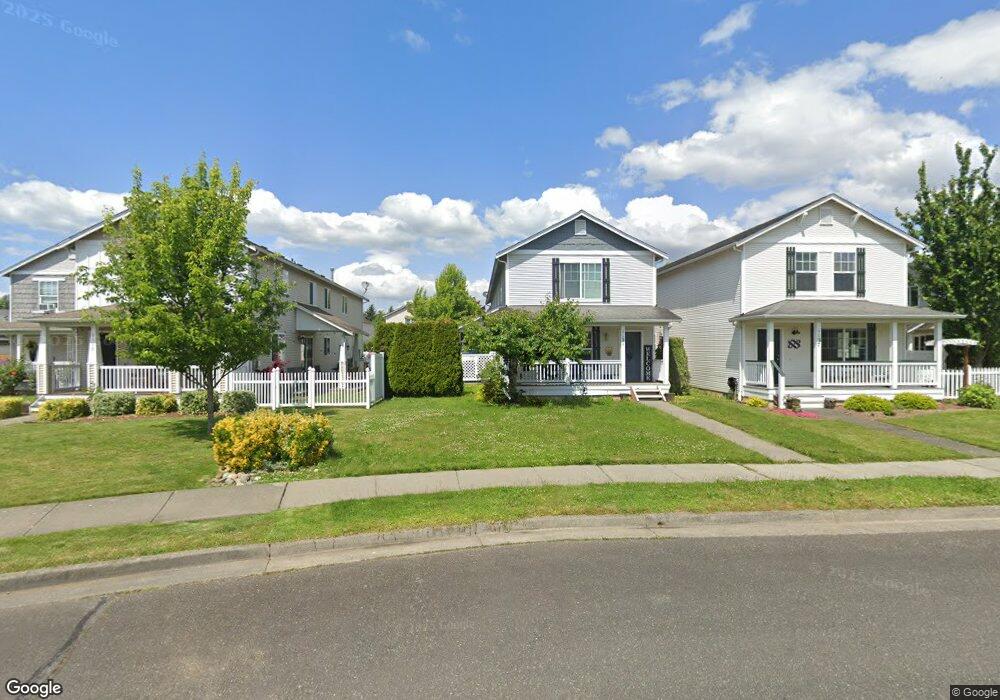
1121 Ash St Lynden, WA 98264
Estimated Value: $577,000 - $617,000
4
Beds
3
Baths
2,240
Sq Ft
$269/Sq Ft
Est. Value
About This Home
This home is located at 1121 Ash St, Lynden, WA 98264 and is currently estimated at $601,933, approximately $268 per square foot. 1121 Ash St is a home located in Whatcom County with nearby schools including Lynden High School, Lynden Christian School, and Cornerstone Christian School.
Ownership History
Date
Name
Owned For
Owner Type
Purchase Details
Closed on
Dec 4, 2003
Sold by
Mobley Robert J
Bought by
Meenderinck Joan E
Current Estimated Value
Home Financials for this Owner
Home Financials are based on the most recent Mortgage that was taken out on this home.
Original Mortgage
$100,908
Outstanding Balance
$47,281
Interest Rate
6.04%
Mortgage Type
Purchase Money Mortgage
Estimated Equity
$554,652
Create a Home Valuation Report for This Property
The Home Valuation Report is an in-depth analysis detailing your home's value as well as a comparison with similar homes in the area
Home Values in the Area
Average Home Value in this Area
Purchase History
| Date | Buyer | Sale Price | Title Company |
|---|---|---|---|
| Meenderinck Joan E | -- | Whatcom Land Title | |
| Meenderinck Joan E | $190,595 | Whatcom Land Title |
Source: Public Records
Mortgage History
| Date | Status | Borrower | Loan Amount |
|---|---|---|---|
| Open | Meenderinck Joan E | $100,908 |
Source: Public Records
Tax History Compared to Growth
Tax History
| Year | Tax Paid | Tax Assessment Tax Assessment Total Assessment is a certain percentage of the fair market value that is determined by local assessors to be the total taxable value of land and additions on the property. | Land | Improvement |
|---|---|---|---|---|
| 2024 | $3,831 | $540,647 | $194,000 | $346,647 |
| 2023 | $3,831 | $533,314 | $200,000 | $333,314 |
| 2022 | $3,631 | $476,942 | $140,798 | $336,144 |
| 2021 | $3,561 | $394,162 | $116,360 | $277,802 |
| 2020 | $3,120 | $351,940 | $103,896 | $248,044 |
| 2019 | $2,775 | $322,767 | $95,394 | $227,373 |
| 2018 | $3,033 | $294,367 | $86,900 | $207,467 |
| 2017 | $2,595 | $264,219 | $78,000 | $186,219 |
| 2016 | $2,448 | $240,487 | $68,200 | $172,287 |
| 2015 | $2,170 | $225,594 | $65,596 | $159,998 |
| 2014 | -- | $217,951 | $63,364 | $154,587 |
| 2013 | -- | $216,587 | $62,000 | $154,587 |
Source: Public Records
Map
Nearby Homes
- 2201 Dejong Dr
- 2205 Dejong Dr
- 1172 Edgewater Ln
- 1136 N Cascade Ct
- 1112 N Cascade Ct
- 1660 Eastwood Way
- 8885 Line Rd
- 9586 Bender Rd
- 1251 Garden Cir
- 1725 Aaron Dr
- 2202 Berryman Loop
- 1402 Bradley Meadows Ln
- 1319 Bradley Ct
- 8639 Bender Rd
- 114 Twin Sister Loop
- 1178 E Grover St Unit 101
- 107 Springview Dr
- 137 E Cedar Dr
- 8844 Depot Rd Unit B204
- 8872 Depot Rd Unit 203