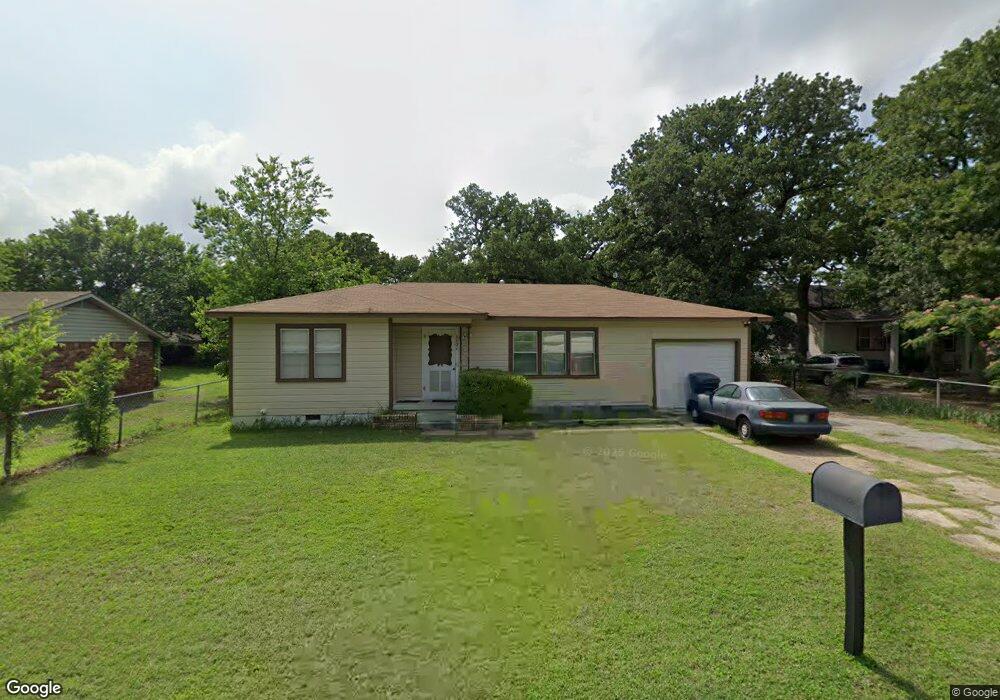
1121 B St SE Ardmore, OK 73401
Estimated Value: $72,000 - $138,000
3
Beds
2
Baths
1,040
Sq Ft
$102/Sq Ft
Est. Value
About This Home
This home is located at 1121 B St SE, Ardmore, OK 73401 and is currently estimated at $105,980, approximately $101 per square foot. 1121 B St SE is a home located in Carter County with nearby schools including Jefferson Elementary School, Ardmore Middle School, and Ardmore High School.
Ownership History
Date
Name
Owned For
Owner Type
Purchase Details
Closed on
Mar 10, 2023
Sold by
Benjamin Kenneth Paul
Bought by
Benjamin Kenneth Paul and Benjamin Mark A
Current Estimated Value
Purchase Details
Closed on
Jun 6, 2007
Sold by
Smith Arnie and Smith Ramona
Bought by
Benjamin Mark
Home Financials for this Owner
Home Financials are based on the most recent Mortgage that was taken out on this home.
Original Mortgage
$48,000
Interest Rate
6.16%
Mortgage Type
New Conventional
Purchase Details
Closed on
Feb 19, 2004
Sold by
Ross Don L
Bought by
Smith Arnie and Smith Ramona
Create a Home Valuation Report for This Property
The Home Valuation Report is an in-depth analysis detailing your home's value as well as a comparison with similar homes in the area
Purchase History
| Date | Buyer | Sale Price | Title Company |
|---|---|---|---|
| Benjamin Kenneth Paul | -- | None Listed On Document | |
| Benjamin Kenneth Paul | -- | None Listed On Document | |
| Benjamin Mark | $48,000 | -- | |
| Benjamin Mark | -- | -- | |
| Smith Arnie | $22,000 | -- |
Source: Public Records
Mortgage History
| Date | Status | Borrower | Loan Amount |
|---|---|---|---|
| Previous Owner | Benjamin Mark | $48,000 |
Source: Public Records
Tax History
| Year | Tax Paid | Tax Assessment Tax Assessment Total Assessment is a certain percentage of the fair market value that is determined by local assessors to be the total taxable value of land and additions on the property. | Land | Improvement |
|---|---|---|---|---|
| 2025 | $548 | $5,493 | $647 | $4,846 |
| 2024 | $548 | $5,231 | $616 | $4,615 |
| 2023 | $522 | $4,983 | $596 | $4,387 |
| 2022 | $454 | $4,746 | $571 | $4,175 |
| 2021 | $456 | $4,520 | $531 | $3,989 |
| 2020 | $428 | $4,305 | $480 | $3,825 |
| 2019 | $418 | $4,308 | $480 | $3,828 |
| 2018 | $426 | $4,311 | $480 | $3,831 |
| 2017 | $410 | $4,489 | $480 | $4,009 |
| 2016 | $411 | $4,405 | $480 | $3,925 |
| 2015 | $347 | $4,518 | $328 | $4,190 |
| 2014 | $432 | $4,825 | $328 | $4,497 |
Source: Public Records
Map
Nearby Homes
Your Personal Tour Guide
Ask me questions while you tour the home.