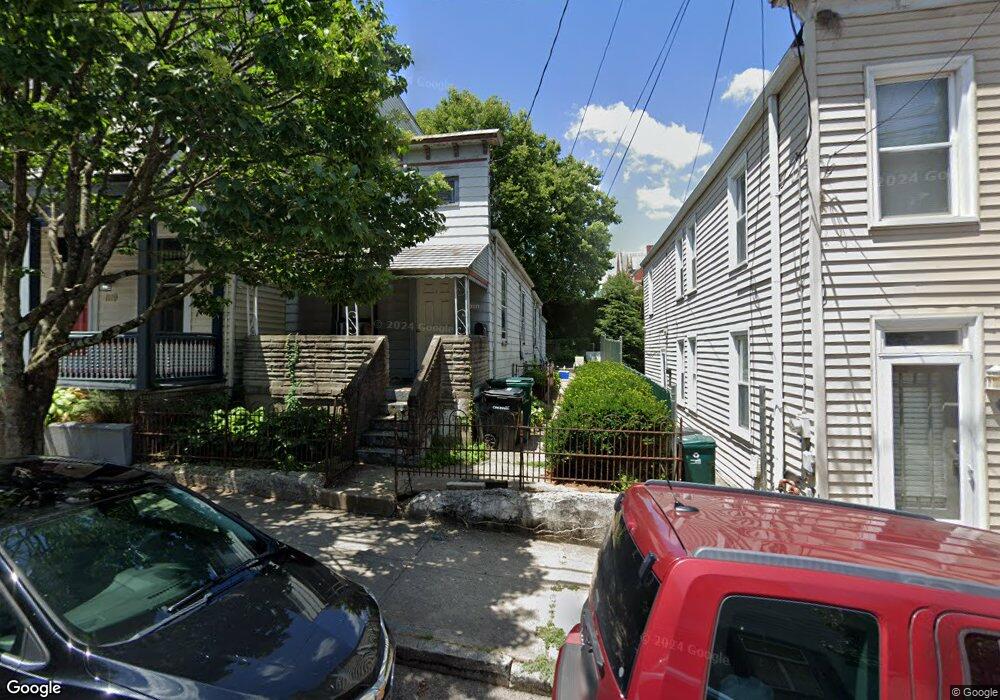
1121 Belvedere St Cincinnati, OH 45202
Mount Adams NeighborhoodEstimated Value: $273,029 - $528,000
1
Bed
2
Baths
934
Sq Ft
$434/Sq Ft
Est. Value
About This Home
This home is located at 1121 Belvedere St, Cincinnati, OH 45202 and is currently estimated at $405,507, approximately $434 per square foot. 1121 Belvedere St is a home located in Hamilton County with nearby schools including Robert A. Taft Information Technology High School, Withrow University High School, and Clark Montessori High School.
Ownership History
Date
Name
Owned For
Owner Type
Purchase Details
Closed on
Mar 27, 2002
Sold by
Argicola Frank O Tr
Bought by
Agricola Gregory A
Current Estimated Value
Home Financials for this Owner
Home Financials are based on the most recent Mortgage that was taken out on this home.
Original Mortgage
$71,300
Outstanding Balance
$28,604
Interest Rate
6.93%
Estimated Equity
$376,903
Purchase Details
Closed on
Mar 28, 1997
Sold by
Agricola Francis O and Agricola Virginia A
Bought by
Agricola Frank O and Agricola Virginia A
Purchase Details
Closed on
Jan 8, 1997
Sold by
Tapp Laura M
Bought by
Agricola Gregory A
Home Financials for this Owner
Home Financials are based on the most recent Mortgage that was taken out on this home.
Original Mortgage
$62,250
Interest Rate
7.58%
Purchase Details
Closed on
Dec 30, 1996
Sold by
Agricola Virginia A
Bought by
Agricola Francis O
Home Financials for this Owner
Home Financials are based on the most recent Mortgage that was taken out on this home.
Original Mortgage
$62,250
Interest Rate
7.58%
Create a Home Valuation Report for This Property
The Home Valuation Report is an in-depth analysis detailing your home's value as well as a comparison with similar homes in the area
Home Values in the Area
Average Home Value in this Area
Purchase History
| Date | Buyer | Sale Price | Title Company |
|---|---|---|---|
| Agricola Gregory A | -- | -- | |
| Agricola Frank O | -- | -- | |
| Agricola Gregory A | -- | -- | |
| Agricola Francis O | -- | -- |
Source: Public Records
Mortgage History
| Date | Status | Borrower | Loan Amount |
|---|---|---|---|
| Open | Agricola Gregory A | $71,300 | |
| Previous Owner | Agricola Francis O | $62,250 |
Source: Public Records
Tax History
| Year | Tax Paid | Tax Assessment Tax Assessment Total Assessment is a certain percentage of the fair market value that is determined by local assessors to be the total taxable value of land and additions on the property. | Land | Improvement |
|---|---|---|---|---|
| 2025 | $5,533 | $87,315 | $55,440 | $31,875 |
| 2024 | $5,525 | $87,315 | $55,440 | $31,875 |
| 2023 | $5,535 | $87,315 | $55,440 | $31,875 |
| 2022 | $5,429 | $77,049 | $53,424 | $23,625 |
| 2021 | $5,337 | $77,049 | $53,424 | $23,625 |
| 2020 | $5,353 | $77,049 | $53,424 | $23,625 |
| 2019 | $5,546 | $72,688 | $50,400 | $22,288 |
| 2018 | $5,551 | $72,688 | $50,400 | $22,288 |
| 2017 | $5,346 | $72,688 | $50,400 | $22,288 |
| 2016 | $5,342 | $70,837 | $48,888 | $21,949 |
| 2015 | $4,774 | $70,837 | $48,888 | $21,949 |
| 2014 | $4,799 | $70,837 | $48,888 | $21,949 |
| 2013 | $5,033 | $73,028 | $50,400 | $22,628 |
Source: Public Records
Map
Nearby Homes
- 949 Pavilion St
- 1054 Saint Paul Place
- 1112 Fuller St
- 1120 Fuller St
- 982 Hatch St
- 330 Oregon St
- 971 Parkside Place
- 341 Oregon St
- 1238 Elsinore Ave
- 1000 Paradrome St
- 989 Parkside Place
- 310 Oregon St
- 328 Oregon St
- 327 Oregon St
- 375 Oregon St
- 325 Oregon St
- 380 Baum St
- 380 Baum St Unit 5B
- 1040 Hatch St
- 502 Baum St
- 1123 Belvedere St
- 1119 Belvedere St
- 1117 Belvedere St
- 1127 Belvedere St
- 1115 Belvedere St
- 1129 Belvedere St
- 1120 Saint Gregory St
- 1131 Belvedere St
- 1128 Saint Gregory St
- 1113 Belvedere St
- 1122 Belvedere St
- 1120 Belvedere St
- 1130 Saint Gregory St
- 1118 Belvedere St
- 1124 Belvedere St
- 1109 Belvedere St
- 1116 Belvedere St
- 1126 Belvedere St
- 1114 Belvedere St
- 1128 Belvedere St
Your Personal Tour Guide
Ask me questions while you tour the home.