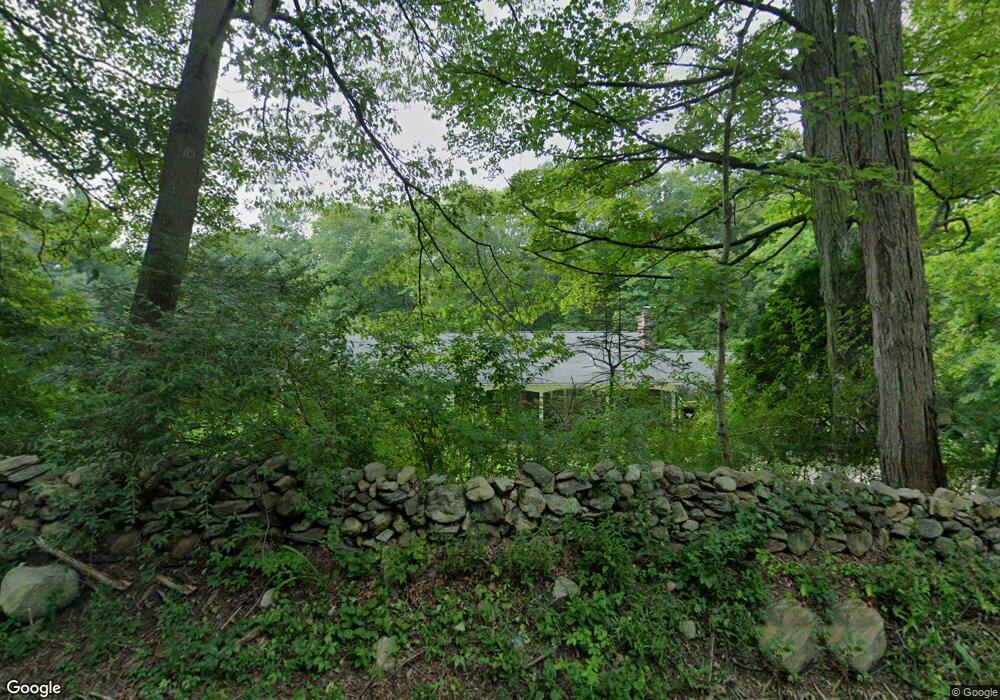
1121 Black Rock Turnpike Easton, CT 06612
Estimated Value: $668,000 - $834,000
4
Beds
3
Baths
1,572
Sq Ft
$466/Sq Ft
Est. Value
About This Home
This home is located at 1121 Black Rock Turnpike, Easton, CT 06612 and is currently estimated at $732,235, approximately $465 per square foot. 1121 Black Rock Turnpike is a home located in Fairfield County with nearby schools including Samuel Staples Elementary School, Helen Keller Middle School, and Joel Barlow High School.
Ownership History
Date
Name
Owned For
Owner Type
Purchase Details
Closed on
May 21, 2021
Sold by
Tomlinson James T and Tomlinson James M
Bought by
Tomlinson James M
Current Estimated Value
Home Financials for this Owner
Home Financials are based on the most recent Mortgage that was taken out on this home.
Original Mortgage
$318,000
Outstanding Balance
$287,282
Interest Rate
2.9%
Mortgage Type
New Conventional
Estimated Equity
$444,953
Purchase Details
Closed on
Jul 13, 2007
Sold by
Kerecz Ursula
Bought by
Tomlinson James E and Tomlinson James M
Home Financials for this Owner
Home Financials are based on the most recent Mortgage that was taken out on this home.
Original Mortgage
$400,000
Interest Rate
6.48%
Create a Home Valuation Report for This Property
The Home Valuation Report is an in-depth analysis detailing your home's value as well as a comparison with similar homes in the area
Home Values in the Area
Average Home Value in this Area
Purchase History
| Date | Buyer | Sale Price | Title Company |
|---|---|---|---|
| Tomlinson James M | -- | None Available | |
| Tomlinson James M | -- | None Available | |
| Tomlinson James M | -- | None Available | |
| Tomlinson James E | $502,500 | -- | |
| Tomlinson James E | $502,500 | -- |
Source: Public Records
Mortgage History
| Date | Status | Borrower | Loan Amount |
|---|---|---|---|
| Open | Tomlinson James M | $318,000 | |
| Closed | Tomlinson James M | $318,000 | |
| Previous Owner | Tomlinson James E | $377,400 | |
| Previous Owner | Tomlinson James E | $400,000 |
Source: Public Records
Tax History Compared to Growth
Tax History
| Year | Tax Paid | Tax Assessment Tax Assessment Total Assessment is a certain percentage of the fair market value that is determined by local assessors to be the total taxable value of land and additions on the property. | Land | Improvement |
|---|---|---|---|---|
| 2025 | $10,861 | $350,350 | $199,990 | $150,360 |
| 2024 | $10,349 | $350,350 | $199,990 | $150,360 |
| 2023 | $10,146 | $350,350 | $199,990 | $150,360 |
| 2022 | $9,926 | $349,020 | $199,990 | $149,030 |
| 2021 | $8,721 | $269,570 | $183,330 | $86,240 |
| 2020 | $8,357 | $269,570 | $183,330 | $86,240 |
| 2019 | $8,446 | $269,570 | $183,330 | $86,240 |
| 2018 | $8,459 | $269,570 | $183,330 | $86,240 |
| 2017 | $8,998 | $269,570 | $183,330 | $86,240 |
| 2016 | $9,485 | $307,860 | $210,470 | $97,390 |
| 2015 | $9,353 | $307,860 | $210,470 | $97,390 |
| 2014 | $9,205 | $307,860 | $210,470 | $97,390 |
Source: Public Records
Map
Nearby Homes
- 16 Black Rock Turnpike
- 280 Newtown Turnpike
- 15 Tunxis Trail
- 235 Rock House Rd
- 897 Sport Hill Rd
- 27 W Woodland Dr
- 100 Honeysuckle Hill Ln
- 492 Newtown Turnpike
- 41 Sullivan Dr
- 85 Westport Rd
- 56 Cross Hwy
- 104 Blue Spruce Cir
- 101 Northwood Dr
- 241 Black Rock Turnpike
- 82 Rock House Rd
- 294 Maple Rd
- 10 Shady Ln
- 80 Norton Rd
- 22 Lonetown Rd
- 8 Messex Ln
- 1111 Black Rock Turnpike
- 1096 Black Rock Turnpike
- 1099 Black Rock Turnpike
- 1092 Black Rock Turnpike
- 1093 Black Rock Turnpike
- 1083 Black Rock Turnpike
- 1074 Black Rock Turnpike
- 1080 Black Rock Turnpike
- 1091 Black Rock Turnpike
- 1068 Black Rock Turnpike
- 1060 Black Rock Turnpike
- 1212 Black Rock Turnpike
- 1054 Black Rock Turnpike
- 25 Country Club Ln
- 1044 Black Rock Turnpike
- 1034 Black Rock Turnpike
- 40 Country Club Ln
- 6 Black Rock Turnpike
- 15 Country Club Ln
- 28 Country Club Ln