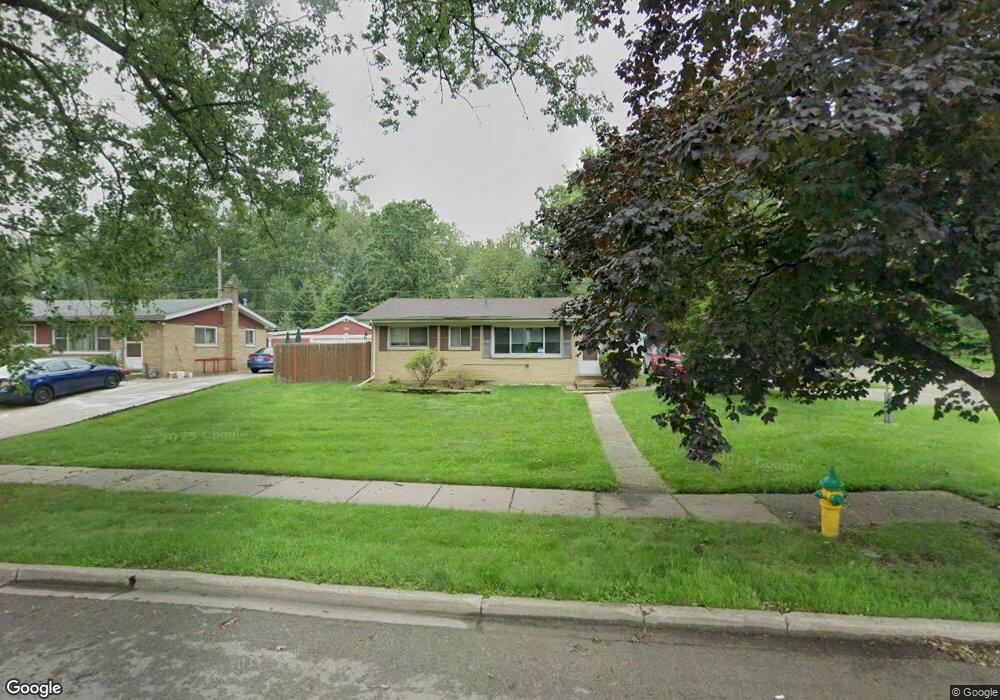
1121 Blanchard Rd Waukegan, IL 60087
Marquette Highlands NeighborhoodEstimated Value: $217,000 - $294,000
2
Beds
1
Bath
1,425
Sq Ft
$181/Sq Ft
Est. Value
About This Home
This home is located at 1121 Blanchard Rd, Waukegan, IL 60087 and is currently estimated at $258,455, approximately $181 per square foot. 1121 Blanchard Rd is a home located in Lake County with nearby schools including John S. Clark Elementary School, Jack Benny Middle School, and Waukegan High School.
Ownership History
Date
Name
Owned For
Owner Type
Purchase Details
Closed on
Apr 28, 2015
Sold by
Five Ten Illinois Iii Llc
Bought by
Csma Ft Llc
Current Estimated Value
Purchase Details
Closed on
Aug 5, 2013
Sold by
Household Finance Corp Iii
Bought by
Five Ten Illinois Iii Llc
Purchase Details
Closed on
Jul 11, 2003
Sold by
Mcferren Margo Washington and Wright Margo
Bought by
Wright James and Wright Margo
Home Financials for this Owner
Home Financials are based on the most recent Mortgage that was taken out on this home.
Original Mortgage
$144,200
Interest Rate
5.47%
Mortgage Type
Purchase Money Mortgage
Purchase Details
Closed on
Aug 25, 1995
Sold by
Moore Paul R and Moore Margaret M
Bought by
Mcferren Paul R and Mcferren Margo Washington
Home Financials for this Owner
Home Financials are based on the most recent Mortgage that was taken out on this home.
Original Mortgage
$98,500
Interest Rate
7.43%
Create a Home Valuation Report for This Property
The Home Valuation Report is an in-depth analysis detailing your home's value as well as a comparison with similar homes in the area
Home Values in the Area
Average Home Value in this Area
Purchase History
| Date | Buyer | Sale Price | Title Company |
|---|---|---|---|
| Csma Ft Llc | $112,000 | Avenue 365 Lender Services | |
| Five Ten Illinois Iii Llc | $70,634 | None Available | |
| Wright James | -- | -- | |
| Mcferren Paul R | $128,500 | -- |
Source: Public Records
Mortgage History
| Date | Status | Borrower | Loan Amount |
|---|---|---|---|
| Previous Owner | Wright James | $144,200 | |
| Previous Owner | Mcferren Paul R | $98,500 |
Source: Public Records
Tax History Compared to Growth
Tax History
| Year | Tax Paid | Tax Assessment Tax Assessment Total Assessment is a certain percentage of the fair market value that is determined by local assessors to be the total taxable value of land and additions on the property. | Land | Improvement |
|---|---|---|---|---|
| 2024 | $6,921 | $81,364 | $15,176 | $66,188 |
| 2023 | $5,610 | $73,394 | $13,690 | $59,704 |
| 2022 | $5,610 | $57,384 | $8,948 | $48,436 |
| 2021 | $5,930 | $56,883 | $8,870 | $48,013 |
| 2020 | $6,007 | $52,993 | $8,263 | $44,730 |
| 2019 | $6,046 | $48,560 | $7,572 | $40,988 |
| 2018 | $5,496 | $42,506 | $9,823 | $32,683 |
| 2017 | $5,390 | $37,606 | $8,691 | $28,915 |
| 2016 | $5,050 | $32,678 | $7,552 | $25,126 |
| 2015 | $4,940 | $29,247 | $6,759 | $22,488 |
| 2014 | $4,505 | $26,627 | $6,842 | $19,785 |
| 2012 | $4,642 | $28,850 | $7,414 | $21,436 |
Source: Public Records
Map
Nearby Homes
- 1612 Whitney St
- 2232 Walnut St
- 2613 N Lewis Ave
- 1636 Rice St
- 301 W Eagle Ct
- 2350 N Lewis Ave
- 0 Traditions Dr
- 1905 Linden Ave
- 37905 N Loyola Ave
- 2246 Alta Vista Dr
- 10241 W Bairstow Ave
- 2213 Alta Vista Dr
- 3211 Rugby Ct
- 37966 N Cornell Rd
- 37231 N Ganster Rd
- 616 W Keith Ave
- 1018 W Atlantic Ave
- 38362 N Manor Ave
- 38127 N Shore Ave
- 2705 Dana Ave
- 2536 Western Ave
- 2532 Western Ave
- 2543 Western Ave
- 2528 Western Ave
- 1111 Blanchard Rd
- 2531 Western Ave
- 2524 Western Ave
- 2527 Western Ave
- 1107 Blanchard Rd
- 2520 Western Ave
- 2521 Western Ave
- 2532 Linden Ave
- 2536 Linden Ave
- 2519 Western Ave
- 2528 Linden Ave Unit 2
- 2528 Linden Ave Unit 1
- 2528 N Linden Ave
- 2516 Western Ave
- 2524 Linden Ave
- 2515 Western Ave