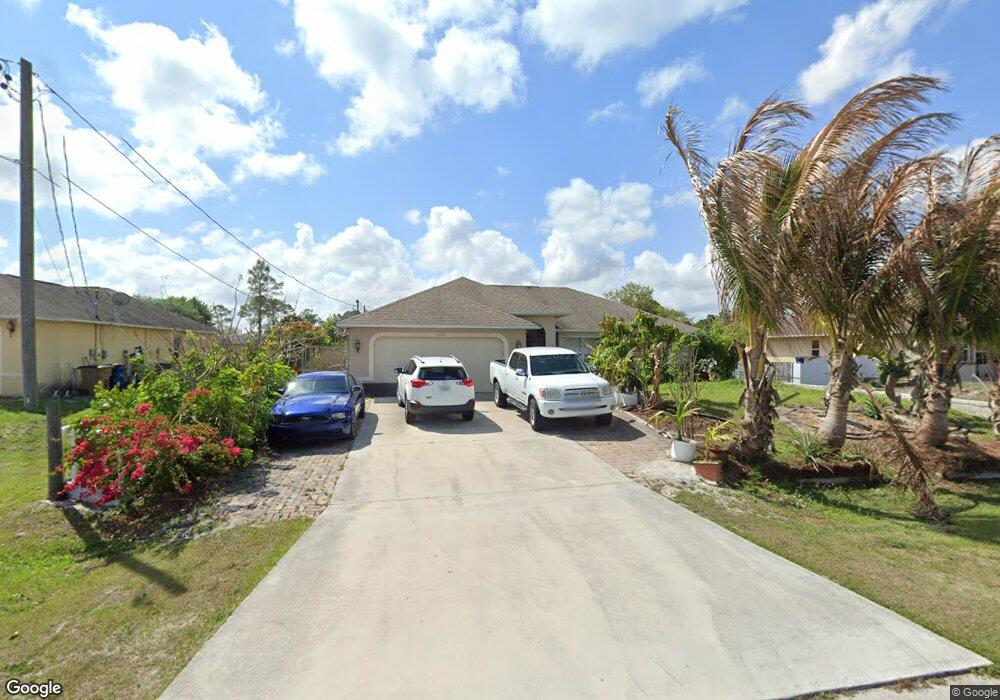
1121 Cabrillo Ave Unit 4 Lehigh Acres, FL 33971
Centennial NeighborhoodEstimated Value: $265,470 - $328,000
3
Beds
2
Baths
1,665
Sq Ft
$178/Sq Ft
Est. Value
About This Home
This home is located at 1121 Cabrillo Ave Unit 4, Lehigh Acres, FL 33971 and is currently estimated at $296,868, approximately $178 per square foot. 1121 Cabrillo Ave Unit 4 is a home located in Lee County with nearby schools including Gateway Elementary School, Lehigh Elementary School, and Tice Elementary School.
Ownership History
Date
Name
Owned For
Owner Type
Purchase Details
Closed on
Jan 24, 2020
Sold by
Carreno Ana Victoria
Bought by
Carreno Victoria and Criollo Juan Pablo Carvajal
Current Estimated Value
Purchase Details
Closed on
Jun 21, 2013
Sold by
Paez Jorge E and Reyes Dennise
Bought by
Carreno Ana Victoria
Purchase Details
Closed on
Apr 25, 2011
Sold by
Reyes Edwin A and Criollo Carmen T
Bought by
Paez Jorge E
Purchase Details
Closed on
Feb 10, 2006
Sold by
Traurig Don
Bought by
Reyes Edwin A
Home Financials for this Owner
Home Financials are based on the most recent Mortgage that was taken out on this home.
Original Mortgage
$203,650
Interest Rate
6.5%
Mortgage Type
Unknown
Purchase Details
Closed on
Jul 15, 2004
Sold by
Cook Beulah C and Cook Dennis R
Bought by
Traurig Don
Create a Home Valuation Report for This Property
The Home Valuation Report is an in-depth analysis detailing your home's value as well as a comparison with similar homes in the area
Home Values in the Area
Average Home Value in this Area
Purchase History
| Date | Buyer | Sale Price | Title Company |
|---|---|---|---|
| Carreno Victoria | -- | None Available | |
| Carreno Ana Victoria | -- | None Available | |
| Paez Jorge E | $43,000 | Accu Title Agency | |
| Reyes Edwin A | $254,600 | Fidelity National Title Ins | |
| Traurig Don | $19,900 | Tradewinds Title Inc |
Source: Public Records
Mortgage History
| Date | Status | Borrower | Loan Amount |
|---|---|---|---|
| Previous Owner | Reyes Edwin A | $203,650 |
Source: Public Records
Tax History
| Year | Tax Paid | Tax Assessment Tax Assessment Total Assessment is a certain percentage of the fair market value that is determined by local assessors to be the total taxable value of land and additions on the property. | Land | Improvement |
|---|---|---|---|---|
| 2025 | $2,834 | $206,250 | $30,454 | $175,796 |
| 2024 | $2,766 | $226,079 | -- | -- |
| 2023 | $2,898 | $219,494 | $0 | $0 |
| 2022 | $2,766 | $213,101 | $18,820 | $194,281 |
| 2021 | $2,527 | $156,049 | $14,409 | $141,640 |
| 2020 | $2,455 | $146,152 | $9,000 | $137,152 |
| 2019 | $2,433 | $146,164 | $7,000 | $139,164 |
| 2018 | $2,290 | $134,856 | $6,600 | $128,256 |
| 2017 | $2,177 | $127,589 | $5,750 | $121,839 |
| 2016 | $1,953 | $105,827 | $8,653 | $97,174 |
| 2015 | $1,771 | $91,598 | $4,060 | $87,538 |
| 2014 | -- | $80,194 | $3,685 | $76,509 |
| 2013 | -- | $64,986 | $2,400 | $62,586 |
Source: Public Records
Map
Nearby Homes
- 5057 Beck Ct
- 7881 Buckingham Rd
- 5043 Benton St
- 1113 Chauncey Ave Unit 1
- 5129 Baron St
- 5220 Billings St
- 5122 Beecher St
- 1021 Cedartree Ave
- 1168 Brooklands Dr
- 1024 Chauncey Ave
- 1019 Cedartree Ave
- 1028 Chauncey Ave
- 1198 Brooklands Dr
- 1204 Brooklands Dr
- 1211 Brooklands Dr
- 8341 Buckingham Rd
- 1733 Gunnery Rd N
- 5249 Centennial Blvd
- 5145 Mulsanne Way
- 1216 Brooklands Dr
- 1119 Cabrillo Ave
- 1123 Cabrillo Ave
- 1122 Cabrillo Ave
- 1125 Cabrillo Ave
- 1117 Cabrillo Ave
- 1124 Cabrillo Ave
- 1120 Cabrillo Ave
- 1126 Cedartree Ave
- 5046 Belrose St
- 1126 Cabrillo Ave
- 5041 Belrose St
- 1119 Cecelia Ave
- 1123 Cecelia Ave
- 5053 Beck Ct Unit 4
- 5053 Billings St
- 5046 Billings St
- 5044 Billings St
- 5043 Belrose St
- 5045 Belrose St
Your Personal Tour Guide
Ask me questions while you tour the home.