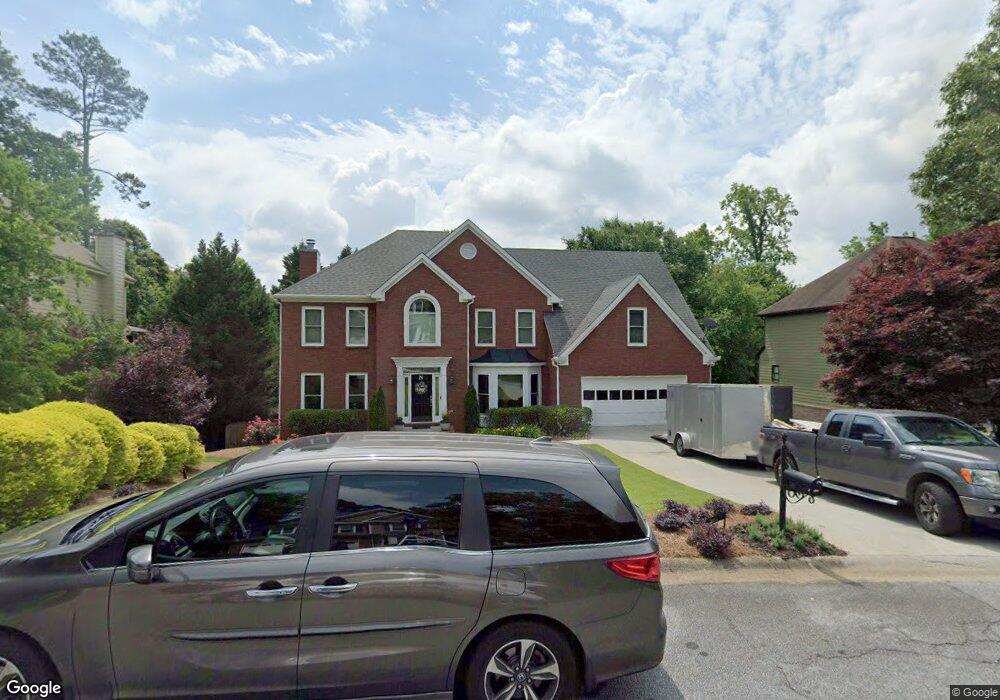
1121 Cedar Bluff Trail SW Lilburn, GA 30047
Estimated Value: $528,000 - $588,033
4
Beds
3
Baths
3,081
Sq Ft
$180/Sq Ft
Est. Value
About This Home
This home is located at 1121 Cedar Bluff Trail SW, Lilburn, GA 30047 and is currently estimated at $554,008, approximately $179 per square foot. 1121 Cedar Bluff Trail SW is a home with nearby schools including Camp Creek Elementary School, Trickum Middle School, and Parkview High School.
Ownership History
Date
Name
Owned For
Owner Type
Purchase Details
Closed on
Dec 7, 2006
Sold by
Washington Mutual Bk
Bought by
Norcini Lawrence and Norcini Candace
Current Estimated Value
Home Financials for this Owner
Home Financials are based on the most recent Mortgage that was taken out on this home.
Original Mortgage
$35,500
Interest Rate
6.06%
Mortgage Type
New Conventional
Purchase Details
Closed on
Oct 18, 2006
Sold by
Fox Thomas M and Fox Nancy P
Bought by
Washington Mutual Bk
Home Financials for this Owner
Home Financials are based on the most recent Mortgage that was taken out on this home.
Original Mortgage
$35,500
Interest Rate
6.06%
Mortgage Type
New Conventional
Purchase Details
Closed on
Jun 2, 1994
Sold by
Wendt Builders Inc
Bought by
Fox Tom Nancy
Home Financials for this Owner
Home Financials are based on the most recent Mortgage that was taken out on this home.
Original Mortgage
$186,300
Interest Rate
6.25%
Create a Home Valuation Report for This Property
The Home Valuation Report is an in-depth analysis detailing your home's value as well as a comparison with similar homes in the area
Home Values in the Area
Average Home Value in this Area
Purchase History
| Date | Buyer | Sale Price | Title Company |
|---|---|---|---|
| Norcini Lawrence | $303,000 | -- | |
| Washington Mutual Bk | $246,000 | -- | |
| Fox Tom Nancy | $207,000 | -- |
Source: Public Records
Mortgage History
| Date | Status | Borrower | Loan Amount |
|---|---|---|---|
| Closed | Norcini Lawrence | $35,500 | |
| Previous Owner | Fox Tom Nancy | $186,300 |
Source: Public Records
Tax History Compared to Growth
Tax History
| Year | Tax Paid | Tax Assessment Tax Assessment Total Assessment is a certain percentage of the fair market value that is determined by local assessors to be the total taxable value of land and additions on the property. | Land | Improvement |
|---|---|---|---|---|
| 2025 | $6,753 | $234,680 | $36,000 | $198,680 |
| 2024 | $6,903 | $233,960 | $36,000 | $197,960 |
| 2023 | $6,903 | $232,160 | $42,800 | $189,360 |
| 2022 | $6,246 | $203,440 | $31,600 | $171,840 |
| 2021 | $5,450 | $160,640 | $27,600 | $133,040 |
| 2020 | $5,290 | $151,480 | $23,600 | $127,880 |
| 2019 | $5,118 | $151,480 | $23,600 | $127,880 |
| 2018 | $4,743 | $133,840 | $19,200 | $114,640 |
| 2016 | $4,318 | $119,120 | $19,200 | $99,920 |
| 2015 | $4,366 | $119,120 | $19,200 | $99,920 |
| 2014 | $4,389 | $119,120 | $19,200 | $99,920 |
Source: Public Records
Map
Nearby Homes
- 4449 Amberleaf Walk
- 4271 Weston Dr SW
- 1093 Hasty Ct SW
- 1043 Wash Lee Dr SW
- 871 Cedar Trace SW
- 4254 Cedar Creek Trail SW Unit 8
- 4245 Cedar Creek Trail SW
- 772 Brookwood Terrace SW
- 1017 Rolling Forest Ln
- 753 Brookwood Terrace SW
- 4307 Cedar Wood Dr SW
- 4367 Cedar Wood Dr SW
- 1296 Mandalay Ct SW
- 676 Killian Hill Rd SW
- 4327 Saint Michaels Dr SW
- 1315 Killian Shoals Way SW
- 5453 Plain Field Ln
- 1111 Cedar Bluff Trail SW
- 1131 Cedar Bluff Trail SW
- 4329 Amberleaf Walk Unit 13
- 4329 Amberleaf Walk
- 1101 Cedar Bluff Trail SW
- 1120 Cedar Bluff Trail SW
- 4319 Amberleaf Walk
- 1110 Cedar Bluff Trail SW Unit 4
- 4349 Amberleaf Walk
- 1141 Cedar Bluff Trail SW
- 4309 Amberleaf Walk
- 1140 Cedar Bluff Trail SW
- 1100 Cedar Bluff Trail SW Unit 4
- 1151 Cedar Bluff Trail SW Unit 4
- 4359 Amberleaf Walk
- 1091 Cedar Bluff Trail SW
- 4299 Amberleaf Walk
- 4208 Amberleaf Walk Unit 48
- 4208 Amberleaf Walk
- 1160 Cedar Bluff Trail SW Unit 4