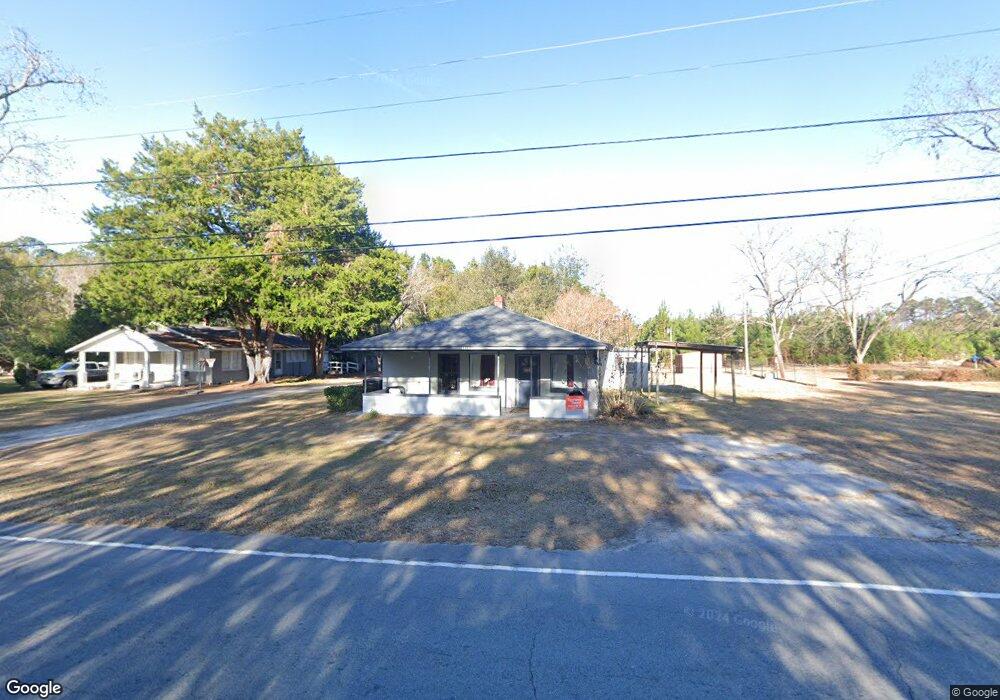
1121 Charleston Hwy Hampton, SC 29924
Estimated Value: $145,000 - $288,000
--
Bed
--
Bath
1,698
Sq Ft
$120/Sq Ft
Est. Value
About This Home
This home is located at 1121 Charleston Hwy, Hampton, SC 29924 and is currently estimated at $204,604, approximately $120 per square foot. 1121 Charleston Hwy is a home located in Hampton County with nearby schools including Hampton County High and Community Christian Academy.
Ownership History
Date
Name
Owned For
Owner Type
Purchase Details
Closed on
Aug 16, 2022
Sold by
Dire Wolf Investmetns Llc
Bought by
Smalls Jeffrey
Current Estimated Value
Home Financials for this Owner
Home Financials are based on the most recent Mortgage that was taken out on this home.
Original Mortgage
$162,894
Outstanding Balance
$155,471
Interest Rate
5.3%
Mortgage Type
FHA
Estimated Equity
$49,133
Purchase Details
Closed on
Feb 24, 2022
Sold by
Marianne Crapse
Bought by
Dire Wolf Investments Llc
Home Financials for this Owner
Home Financials are based on the most recent Mortgage that was taken out on this home.
Original Mortgage
$76,500
Interest Rate
3.55%
Mortgage Type
New Conventional
Purchase Details
Closed on
Jun 7, 2017
Sold by
Gooding Cecil
Bought by
Crapse Marianne
Home Financials for this Owner
Home Financials are based on the most recent Mortgage that was taken out on this home.
Original Mortgage
$55,700
Interest Rate
4.05%
Mortgage Type
Purchase Money Mortgage
Create a Home Valuation Report for This Property
The Home Valuation Report is an in-depth analysis detailing your home's value as well as a comparison with similar homes in the area
Home Values in the Area
Average Home Value in this Area
Purchase History
| Date | Buyer | Sale Price | Title Company |
|---|---|---|---|
| Smalls Jeffrey | $165,900 | None Listed On Document | |
| Dire Wolf Investments Llc | $60,000 | None Listed On Document | |
| Crapse Marianne | $57,700 | None Available |
Source: Public Records
Mortgage History
| Date | Status | Borrower | Loan Amount |
|---|---|---|---|
| Open | Smalls Jeffrey | $162,894 | |
| Previous Owner | Dire Wolf Investments Llc | $76,500 | |
| Previous Owner | Crapse Marianne | $55,700 | |
| Closed | Smalls Jeffrey | $6,515 |
Source: Public Records
Tax History Compared to Growth
Tax History
| Year | Tax Paid | Tax Assessment Tax Assessment Total Assessment is a certain percentage of the fair market value that is determined by local assessors to be the total taxable value of land and additions on the property. | Land | Improvement |
|---|---|---|---|---|
| 2024 | $2,049 | $4,030 | $210 | $3,820 |
| 2023 | $2,049 | $4,030 | $0 | $0 |
| 2022 | $485 | $1,960 | $140 | $1,820 |
| 2021 | $464 | $1,960 | $140 | $1,820 |
| 2020 | $541 | $2,160 | $2,020 | $140 |
| 2018 | $528 | $2,160 | $2,020 | $140 |
| 2017 | $1,460 | $2,160 | $2,020 | $140 |
| 2016 | $541 | $3,250 | $3,030 | $220 |
| 2015 | -- | $2,160 | $140 | $2,020 |
| 2014 | -- | $1,980 | $0 | $0 |
| 2013 | -- | $1,980 | $0 | $0 |
Source: Public Records
Map
Nearby Homes
- 211 Susanne St
- Tbd Charleston Hwy
- 110 Nix St E
- 800 Doctor Young Rd
- 813 Doctor Young Rd
- 00 Wade Hampton Rd
- 2025 Charleston Hwy
- 110 Woodland Ave
- 156 Maple St W
- 407 Elm St E
- 14 Mulberry St W
- 1 Elm St E
- Tbd Elm St E
- 801 Elm St E
- 422 Hoover St N
- 401 Mulberry St W
- 686 W Pine St
- 205 Elm St W
- 501 Elm St W
- 802 5th St E
- 1153 Charleston Hwy
- 1106 Charleston Hwy
- 1065 Charleston Hwy
- 1201 Charleston Hwy
- 103 Middle St E
- 100 Middle St E
- 105 Middle St E
- 1194 Charleston Hwy
- 0 Middle St Unit 20030007
- 201 Middle St E
- 1244 Charleston Hwy
- 202 Middle St E
- 1293 Co op Rd E
- 203 Middle St E
- 195 Mole Hill Bypass
- 100 Hanna St
- 145 Williams St
- 206 Middle St E
- 148 Williams St
- 207 Middle St E