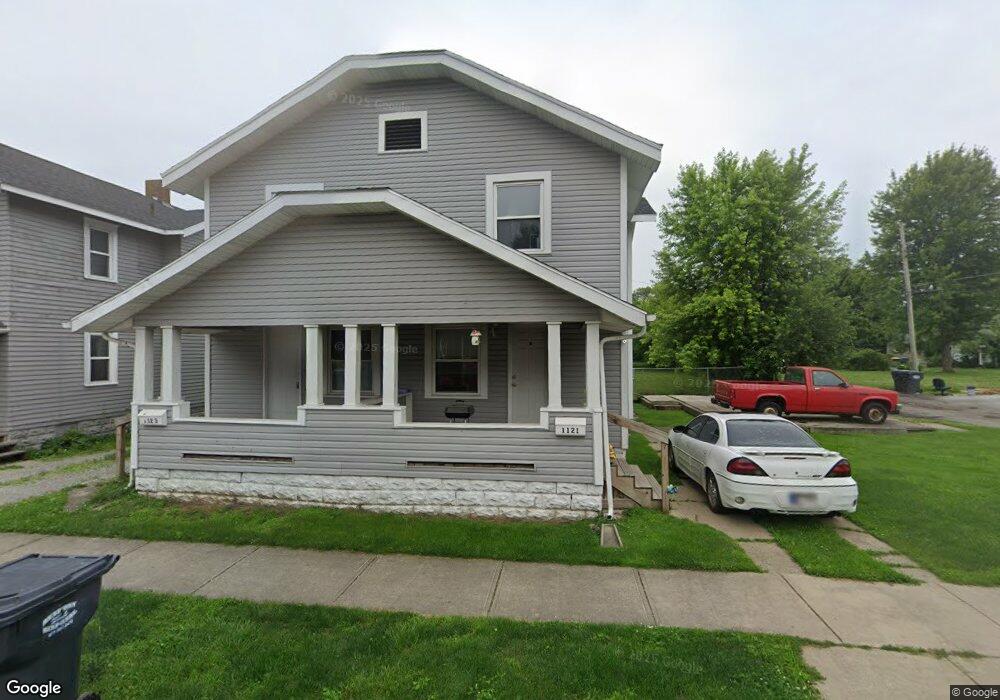
1121 E 30th St Unit 1127-1129 E. 30TH Anderson, IN 46016
Estimated Value: $127,000 - $255,112
6
Beds
2
Baths
5,544
Sq Ft
$38/Sq Ft
Est. Value
About This Home
This home is located at 1121 E 30th St Unit 1127-1129 E. 30TH, Anderson, IN 46016 and is currently estimated at $209,028, approximately $37 per square foot. 1121 E 30th St Unit 1127-1129 E. 30TH is a home located in Madison County with nearby schools including Valley Grove Elementary School, Highland Middle School, and Anderson High School.
Ownership History
Date
Name
Owned For
Owner Type
Purchase Details
Closed on
Oct 3, 2024
Sold by
Aurum 2 Llc
Bought by
American International Home Investments Fund
Current Estimated Value
Purchase Details
Closed on
Aug 29, 2023
Sold by
Grand Slam Properties Llc
Bought by
Potter Enterprises Llc and P & R Sairam Llc
Home Financials for this Owner
Home Financials are based on the most recent Mortgage that was taken out on this home.
Original Mortgage
$156,750
Interest Rate
6.06%
Mortgage Type
New Conventional
Purchase Details
Closed on
Aug 25, 2016
Sold by
H Group Of Indiana Llc
Bought by
Grand Slam Properties Llc
Purchase Details
Closed on
Oct 19, 2009
Sold by
U S Bank National Association
Bought by
H Group Of Indiana
Purchase Details
Closed on
May 8, 2009
Sold by
Looper Jesse and Looper April
Bought by
Us Bank Na
Create a Home Valuation Report for This Property
The Home Valuation Report is an in-depth analysis detailing your home's value as well as a comparison with similar homes in the area
Home Values in the Area
Average Home Value in this Area
Purchase History
| Date | Buyer | Sale Price | Title Company |
|---|---|---|---|
| American International Home Investments Fund | -- | Fidelity National Title | |
| Aurum 2 Llc | -- | Fidelity National Title | |
| Potter Enterprises Llc | -- | Lenders Escrow & Title | |
| Grand Slam Properties Llc | -- | -- | |
| H Group Of Indiana | -- | -- | |
| Us Bank Na | $60,300 | -- |
Source: Public Records
Mortgage History
| Date | Status | Borrower | Loan Amount |
|---|---|---|---|
| Previous Owner | Potter Enterprises Llc | $156,750 |
Source: Public Records
Tax History Compared to Growth
Tax History
| Year | Tax Paid | Tax Assessment Tax Assessment Total Assessment is a certain percentage of the fair market value that is determined by local assessors to be the total taxable value of land and additions on the property. | Land | Improvement |
|---|---|---|---|---|
| 2025 | $2,180 | $98,100 | $8,900 | $89,200 |
| 2024 | $2,180 | $98,100 | $8,900 | $89,200 |
| 2023 | $2,063 | $92,200 | $8,900 | $83,300 |
| 2022 | $2,063 | $92,200 | $8,900 | $83,300 |
| 2021 | $2,041 | $90,700 | $8,900 | $81,800 |
| 2020 | $1,468 | $65,000 | $5,400 | $59,600 |
| 2019 | $1,432 | $63,300 | $5,400 | $57,900 |
| 2018 | $1,332 | $57,700 | $5,400 | $52,300 |
| 2017 | $1,196 | $59,800 | $5,400 | $54,400 |
| 2016 | $1,372 | $68,600 | $5,400 | $63,200 |
| 2014 | $1,358 | $67,900 | $5,400 | $62,500 |
| 2013 | $1,358 | $58,200 | $4,700 | $53,500 |
Source: Public Records
Map
Nearby Homes
- 3025 Saint Charles St
- 1135 Manor Ct
- 3104 E Lynn St
- 1203 E 27th St
- 3302 Columbus Ave
- 1200 E 26th St
- 711 E 32nd St
- 621 E 31st St
- 3411 Columbus Ave
- 329 E 31st St
- 320 E 34th St
- 309 E 34th St
- 2915 Central Ave
- 2639 Central Ave
- 2420 Fletcher St
- 3918 Columbus Ave
- 2328 Fletcher St
- 2025 George St
- 2007 Columbus Ave
- 2806 Meridian St
- 1121 E 30th St
- 1107 E 30th St
- 3021 Saint Charles St
- 1120 E 30th St
- 3033 Saint Charles St
- 3004 E Lynn St
- 3012 E Lynn St
- 2932 E Lynn St
- 3016 E Lynn St
- 2928 E Lynn St
- 1124 Manor Ct
- 1128 E 31st St
- 3024 Saint Charles St
- 3028 Saint Charles St
- 3020 Saint Charles St
- 1128 Manor Ct
- 2924 E Lynn St
- 3022 E Lynn St
- 1132 Manor Ct
- 1136 Manor Ct