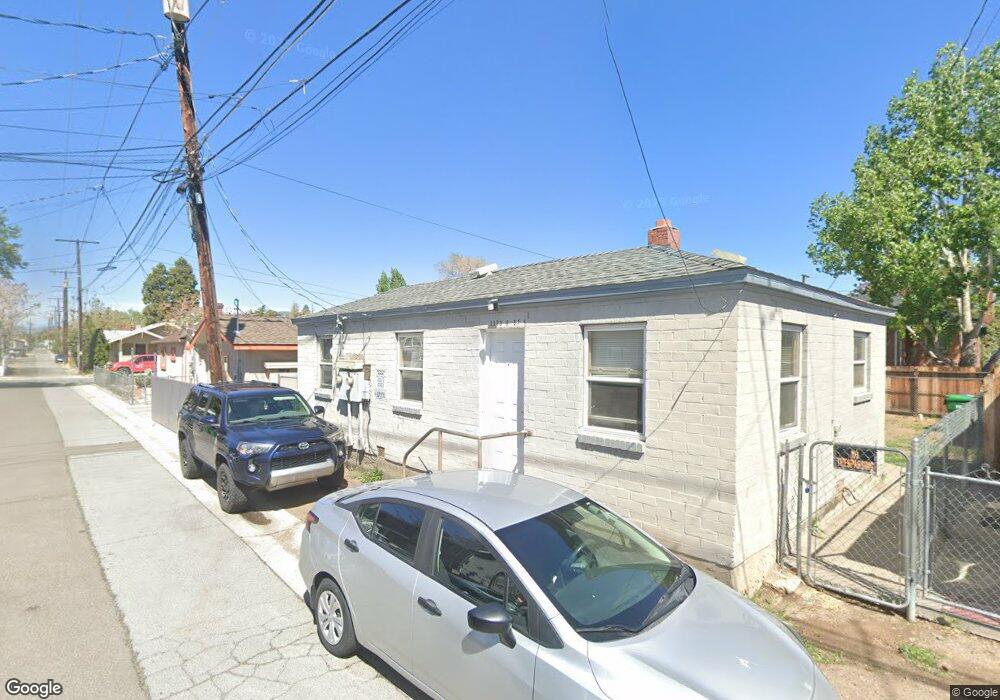
1121 F St Sparks, NV 89431
Downtown Sparks NeighborhoodEstimated Value: $343,952 - $556,000
4
Beds
2
Baths
845
Sq Ft
$509/Sq Ft
Est. Value
About This Home
This home is located at 1121 F St, Sparks, NV 89431 and is currently estimated at $429,988, approximately $508 per square foot. 1121 F St is a home located in Washoe County with nearby schools including Robert Mitchell Elementary School, Sparks Middle School, and Sparks High School.
Ownership History
Date
Name
Owned For
Owner Type
Purchase Details
Closed on
May 27, 2003
Sold by
Ritter George D
Bought by
Press Homi K and Press Meher
Current Estimated Value
Home Financials for this Owner
Home Financials are based on the most recent Mortgage that was taken out on this home.
Original Mortgage
$91,800
Outstanding Balance
$40,125
Interest Rate
5.75%
Mortgage Type
Unknown
Estimated Equity
$389,863
Purchase Details
Closed on
Sep 11, 2001
Sold by
Eisenberg Ira M
Bought by
Ritter George D
Purchase Details
Closed on
May 31, 2001
Sold by
Ritter Christine
Bought by
Ritter George D
Create a Home Valuation Report for This Property
The Home Valuation Report is an in-depth analysis detailing your home's value as well as a comparison with similar homes in the area
Home Values in the Area
Average Home Value in this Area
Purchase History
| Date | Buyer | Sale Price | Title Company |
|---|---|---|---|
| Press Homi K | $102,450 | Founders Title Company Of Nv | |
| Ritter George D | $60,000 | -- | |
| Ritter George D | -- | Stewart Title Of Northern Nv |
Source: Public Records
Mortgage History
| Date | Status | Borrower | Loan Amount |
|---|---|---|---|
| Open | Press Homi K | $91,800 |
Source: Public Records
Tax History Compared to Growth
Tax History
| Year | Tax Paid | Tax Assessment Tax Assessment Total Assessment is a certain percentage of the fair market value that is determined by local assessors to be the total taxable value of land and additions on the property. | Land | Improvement |
|---|---|---|---|---|
| 2025 | $653 | $43,674 | $33,376 | $10,298 |
| 2024 | $653 | $41,168 | $30,968 | $10,200 |
| 2023 | $605 | $40,528 | $31,444 | $9,084 |
| 2022 | $561 | $33,851 | $26,292 | $7,559 |
| 2021 | $517 | $27,515 | $20,300 | $7,215 |
| 2020 | $484 | $28,180 | $21,000 | $7,180 |
| 2019 | $461 | $24,811 | $17,976 | $6,835 |
| 2018 | $440 | $18,691 | $12,152 | $6,539 |
| 2017 | $422 | $17,691 | $11,200 | $6,491 |
| 2016 | $412 | $15,380 | $8,960 | $6,420 |
| 2015 | $411 | $12,742 | $6,440 | $6,302 |
| 2014 | $398 | $11,515 | $5,600 | $5,915 |
| 2013 | -- | $10,685 | $4,928 | $5,757 |
Source: Public Records
Map
Nearby Homes