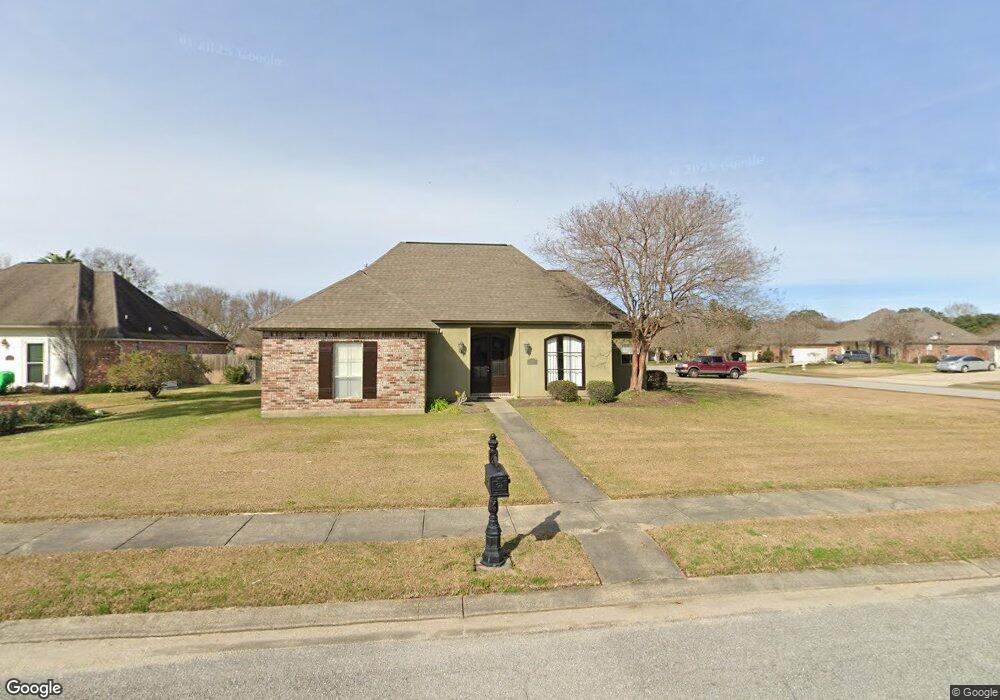
1121 Fairwinds Ave Zachary, LA 70791
Estimated Value: $328,000 - $354,000
4
Beds
3
Baths
1,966
Sq Ft
$174/Sq Ft
Est. Value
About This Home
This home is located at 1121 Fairwinds Ave, Zachary, LA 70791 and is currently estimated at $341,649, approximately $173 per square foot. 1121 Fairwinds Ave is a home located in East Baton Rouge Parish with nearby schools including Northwestern Elementary School, Rollins Place Elementary School, and Zachary Elementary School.
Ownership History
Date
Name
Owned For
Owner Type
Purchase Details
Closed on
Mar 28, 2008
Sold by
Adams Edward A
Bought by
Prejean Andre M
Current Estimated Value
Home Financials for this Owner
Home Financials are based on the most recent Mortgage that was taken out on this home.
Original Mortgage
$200,000
Outstanding Balance
$125,030
Interest Rate
5.72%
Mortgage Type
New Conventional
Estimated Equity
$216,619
Purchase Details
Closed on
Dec 20, 2006
Sold by
Dupras David B
Bought by
Adams Edward A
Home Financials for this Owner
Home Financials are based on the most recent Mortgage that was taken out on this home.
Original Mortgage
$183,200
Interest Rate
6.27%
Mortgage Type
New Conventional
Purchase Details
Closed on
Oct 28, 2005
Sold by
Ledoux Builders
Bought by
Dupras David B
Home Financials for this Owner
Home Financials are based on the most recent Mortgage that was taken out on this home.
Original Mortgage
$158,050
Interest Rate
5.73%
Mortgage Type
New Conventional
Create a Home Valuation Report for This Property
The Home Valuation Report is an in-depth analysis detailing your home's value as well as a comparison with similar homes in the area
Home Values in the Area
Average Home Value in this Area
Purchase History
| Date | Buyer | Sale Price | Title Company |
|---|---|---|---|
| Prejean Andre M | $250,000 | -- | |
| Adams Edward A | $229,000 | -- | |
| Dupras David B | $197,600 | -- |
Source: Public Records
Mortgage History
| Date | Status | Borrower | Loan Amount |
|---|---|---|---|
| Open | Prejean Andre M | $200,000 | |
| Previous Owner | Adams Edward A | $183,200 | |
| Previous Owner | Adams Edward A | $34,350 | |
| Previous Owner | Dupras David B | $158,050 |
Source: Public Records
Tax History Compared to Growth
Tax History
| Year | Tax Paid | Tax Assessment Tax Assessment Total Assessment is a certain percentage of the fair market value that is determined by local assessors to be the total taxable value of land and additions on the property. | Land | Improvement |
|---|---|---|---|---|
| 2024 | $3,141 | $31,440 | $4,400 | $27,040 |
| 2023 | $3,141 | $27,510 | $4,400 | $23,110 |
| 2022 | $3,579 | $27,510 | $4,400 | $23,110 |
| 2021 | $3,579 | $27,510 | $4,400 | $23,110 |
| 2020 | $3,558 | $27,510 | $4,400 | $23,110 |
| 2019 | $3,541 | $25,000 | $4,400 | $20,600 |
| 2018 | $3,554 | $25,000 | $4,400 | $20,600 |
| 2017 | $3,554 | $25,000 | $4,400 | $20,600 |
| 2016 | $2,445 | $25,000 | $4,400 | $20,600 |
| 2015 | $2,443 | $25,000 | $4,400 | $20,600 |
| 2014 | $2,435 | $25,000 | $4,400 | $20,600 |
| 2013 | -- | $25,000 | $4,400 | $20,600 |
Source: Public Records
Map
Nearby Homes
- 22330 Fairway View Dr
- 22259 Sand Trap Way
- TBD Plains-Port Hudson Rd
- 21645 Ligon Rd
- 23324 Portwood Ln
- 22881 Brittney Renee Dr
- 23434 Portwood Ln
- 22336 Sutter Ln
- 22614 Plainsland Dr
- 22460 Sutter Ln
- 515 E Plains Port Hudson Rd
- 22658 Sutter Ln
- 23045 Elberta Ln
- 23316 Elberta Ln
- 22977 Treakle Ln
- 1650 E Flonacher Rd
- Lot 50 Treakle Dr
- 347 E Plains Port Hudson Rd
- 23413 Treakle Ln
- 25247 Shane Ct
- 43 Beaver Cove Ct
- 0 Beaver Cove Ct
- 42 Beaver Cove Ct
- 41 Beaver Cove Ct
- 40 Beaver Cove Ct
- 39 Beaver Cove Ct
- 38 Beaver Cove Ct
- 37 Beaver Cove Ct
- 1111 Fairwinds Ave
- 22717 Beaver Cove Ct
- 1141 Fairwinds Ave
- 1120 Fairwinds Ave
- 1130 Fairwinds Ave
- 22728 Beaver Cove Ct
- 22727 Beaver Cove Ct
- 1110 Fairwinds Ave
- 1029 Fairwinds Ave
- 22737 Beaver Cove Ct
- 1140 Fairwinds Ave
- 22748 Beaver Cove Ct