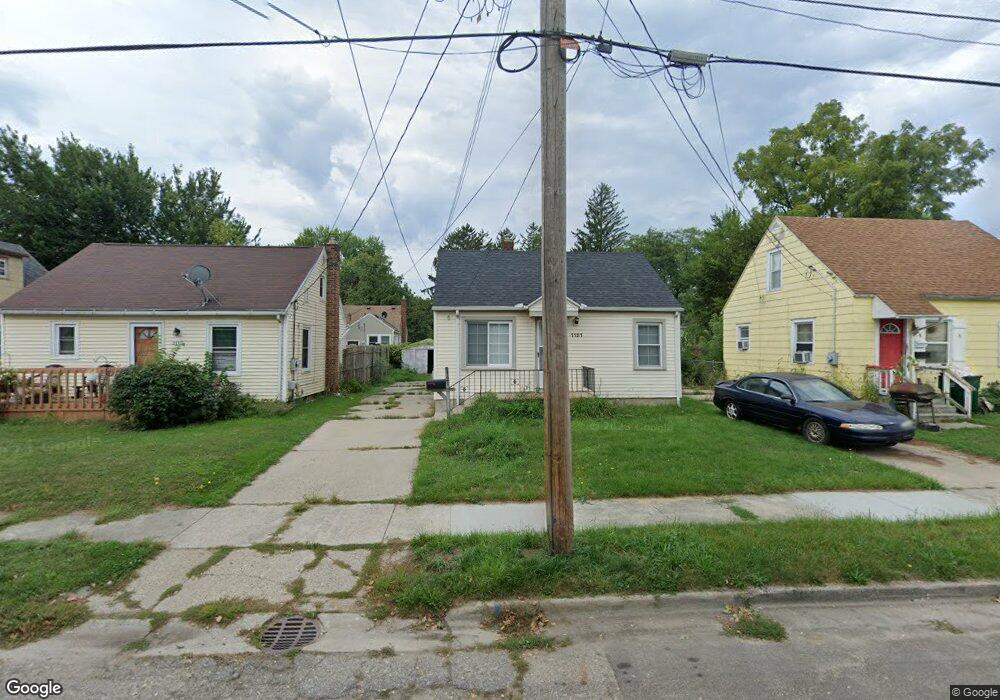
1121 Hapeman St Lansing, MI 48915
Hull Court Park NeighborhoodEstimated Value: $69,000 - $107,000
2
Beds
1
Bath
658
Sq Ft
$128/Sq Ft
Est. Value
About This Home
This home is located at 1121 Hapeman St, Lansing, MI 48915 and is currently estimated at $84,027, approximately $127 per square foot. 1121 Hapeman St is a home located in Ingham County with nearby schools including Willow School, Pattengill Academy, and J.W. Sexton High School.
Ownership History
Date
Name
Owned For
Owner Type
Purchase Details
Closed on
May 11, 2023
Sold by
Wren Deborah J
Bought by
Minc Llc
Current Estimated Value
Purchase Details
Closed on
Dec 16, 2016
Sold by
Jpmorgan Chase Bank N A
Bought by
Wren Deborah Jean
Purchase Details
Closed on
Dec 17, 2015
Sold by
Mahoney Lee P
Bought by
Jpmorgan Chase Bank Na
Purchase Details
Closed on
Dec 15, 2009
Sold by
Donovan Shaun
Bought by
Mahoney Lee
Home Financials for this Owner
Home Financials are based on the most recent Mortgage that was taken out on this home.
Original Mortgage
$33,580
Interest Rate
4.96%
Mortgage Type
FHA
Purchase Details
Closed on
Jun 15, 2009
Sold by
The Bank Of New York Mellon
Bought by
The Secretary Of Housing & Urban Develop
Purchase Details
Closed on
May 14, 2009
Sold by
Hall Debora L
Bought by
The Bank Of New York Mellon and The Bank Of New York
Purchase Details
Closed on
Feb 14, 1997
Sold by
Gidner Rodney Craig and Gidner Lorinda
Bought by
Hall Debora
Create a Home Valuation Report for This Property
The Home Valuation Report is an in-depth analysis detailing your home's value as well as a comparison with similar homes in the area
Home Values in the Area
Average Home Value in this Area
Purchase History
| Date | Buyer | Sale Price | Title Company |
|---|---|---|---|
| Minc Llc | -- | None Listed On Document | |
| Wren Deborah Jean | $19,550 | None Available | |
| Jpmorgan Chase Bank Na | $23,700 | None Available | |
| Mahoney Lee | $34,200 | Tri County | |
| The Secretary Of Housing & Urban Develop | -- | None Available | |
| The Bank Of New York Mellon | $40,371 | None Available | |
| Hall Debora | $41,000 | -- |
Source: Public Records
Mortgage History
| Date | Status | Borrower | Loan Amount |
|---|---|---|---|
| Previous Owner | Mahoney Lee | $33,580 |
Source: Public Records
Tax History
| Year | Tax Paid | Tax Assessment Tax Assessment Total Assessment is a certain percentage of the fair market value that is determined by local assessors to be the total taxable value of land and additions on the property. | Land | Improvement |
|---|---|---|---|---|
| 2025 | $2,696 | $37,000 | $4,800 | $32,200 |
| 2024 | $22 | $31,800 | $4,800 | $27,000 |
| 2023 | $2,069 | $28,700 | $4,800 | $23,900 |
| 2022 | $1,709 | $25,200 | $5,000 | $20,200 |
| 2021 | $1,670 | $24,200 | $4,500 | $19,700 |
| 2020 | $1,658 | $22,000 | $4,500 | $17,500 |
| 2019 | $1,600 | $21,000 | $4,500 | $16,500 |
| 2018 | $1,519 | $18,700 | $4,500 | $14,200 |
| 2017 | $1,661 | $18,700 | $4,500 | $14,200 |
| 2016 | $1,080 | $18,400 | $4,500 | $13,900 |
| 2015 | $1,080 | $17,500 | $9,055 | $8,445 |
| 2014 | $1,080 | $18,300 | $12,500 | $5,800 |
Source: Public Records
Map
Nearby Homes
- 1105 Comfort St
- 1100 Comfort St
- 1624 W Willow St
- 1310 W Maple St
- 1348 N Jenison Ave
- 1224 Theodore St
- 1418 Keeney Ct
- 816 Comfort St
- 1218 Linwood St
- 1408 Glenrose Ave
- 1130 Theodore St
- 821 N Verlinden Ave
- 1335 N Martin Luther King Junior Blvd
- 1421 Lamont St
- 933 N Martin Luther King Junior Blvd
- 1019 Daleford Ave
- 1527 Robertson Ave
- 736 Stanley St
- 1522 Robertson Ave
- 919 Princeton Ave
- 1123 Hapeman St
- 1117 Hapeman St
- 1113 Hapeman St
- 1127 Hapeman St
- 1120 Comfort St
- 1122 Comfort St
- 1116 Comfort St
- 1128 Comfort St
- 1112 Comfort St
- 1109 Hapeman St
- 1120 Hapeman St
- 1116 Hapeman St
- 1135 Hapeman St
- 1132 Comfort St
- 1126 Hapeman St
- 1112 Hapeman St
- 1105 Hapeman St
- 1108 Hapeman St
- 1130 Hapeman St
Your Personal Tour Guide
Ask me questions while you tour the home.