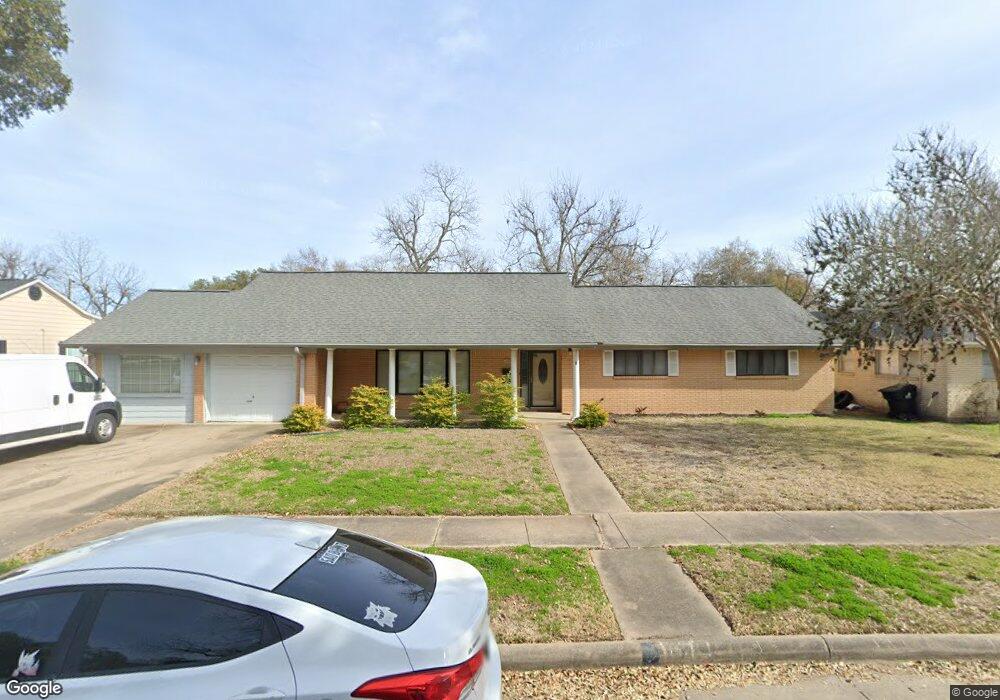
1121 Macarthur St Rosenberg, TX 77471
Estimated Value: $247,947 - $300,000
3
Beds
2
Baths
2,007
Sq Ft
$135/Sq Ft
Est. Value
About This Home
This home is located at 1121 Macarthur St, Rosenberg, TX 77471 and is currently estimated at $271,487, approximately $135 per square foot. 1121 Macarthur St is a home located in Fort Bend County with nearby schools including Travis Elementary School, George Junior High School, and B.F. Terry High School.
Ownership History
Date
Name
Owned For
Owner Type
Purchase Details
Closed on
Aug 31, 2010
Sold by
Brackett Ronald Jack and Brackett Freida C
Bought by
Pineda Joel A and Pineda Michelle S
Current Estimated Value
Home Financials for this Owner
Home Financials are based on the most recent Mortgage that was taken out on this home.
Original Mortgage
$122,000
Outstanding Balance
$81,131
Interest Rate
4.58%
Mortgage Type
New Conventional
Estimated Equity
$190,356
Purchase Details
Closed on
Sep 29, 2000
Sold by
Pool Sidney D and Pool Nora D
Bought by
Brackett Ronald Jack and Brackett Freida C
Home Financials for this Owner
Home Financials are based on the most recent Mortgage that was taken out on this home.
Original Mortgage
$64,872
Interest Rate
7.99%
Mortgage Type
VA
Purchase Details
Closed on
Feb 17, 1994
Sold by
Terry Helen T
Bought by
Pineda Joel A and Pineda Michelle S
Create a Home Valuation Report for This Property
The Home Valuation Report is an in-depth analysis detailing your home's value as well as a comparison with similar homes in the area
Home Values in the Area
Average Home Value in this Area
Purchase History
| Date | Buyer | Sale Price | Title Company |
|---|---|---|---|
| Pineda Joel A | -- | Stewart Title Richmond | |
| Brackett Ronald Jack | -- | Houston Title | |
| Pineda Joel A | -- | -- |
Source: Public Records
Mortgage History
| Date | Status | Borrower | Loan Amount |
|---|---|---|---|
| Open | Pineda Joel A | $122,000 | |
| Previous Owner | Brackett Ronald Jack | $64,872 |
Source: Public Records
Tax History
| Year | Tax Paid | Tax Assessment Tax Assessment Total Assessment is a certain percentage of the fair market value that is determined by local assessors to be the total taxable value of land and additions on the property. | Land | Improvement |
|---|---|---|---|---|
| 2025 | $5,100 | $264,600 | $119,980 | $144,620 |
| 2024 | $5,100 | $270,000 | $119,980 | $150,020 |
| 2023 | $4,685 | $242,695 | $94,413 | $148,282 |
| 2022 | $5,489 | $268,010 | $94,410 | $173,600 |
| 2021 | $4,045 | $194,940 | $84,080 | $110,860 |
| 2020 | $3,893 | $183,410 | $83,100 | $100,310 |
| 2019 | $3,808 | $166,740 | $47,910 | $118,830 |
| 2018 | $3,518 | $151,580 | $47,910 | $103,670 |
| 2017 | $3,216 | $137,800 | $47,910 | $89,890 |
| 2016 | $3,216 | $137,800 | $47,910 | $89,890 |
| 2015 | $2,728 | $137,800 | $47,910 | $89,890 |
| 2014 | $2,726 | $130,000 | $47,910 | $82,090 |
Source: Public Records
Map
Nearby Homes
- 1115 Macarthur St
- 1125 Macarthur St
- 1109 Macarthur St
- 0 Macarthur St
- 1118 San Jacinto St Unit 1120
- 1114 San Jacinto St
- 1118 Macarthur St
- 1126 San Jacinto St
- 1120 Macarthur St
- 1103 Macarthur St
- 1110 San Jacinto St
- 1122 Macarthur St
- 1124 Macarthur St
- 1100 Macarthur St
- 1201 Macarthur St
- 1113 Ward St
- 1200 San Jacinto St
- 1115 San Jacinto St
- 1119 San Jacinto St
- 1131 Ward St
Your Personal Tour Guide
Ask me questions while you tour the home.