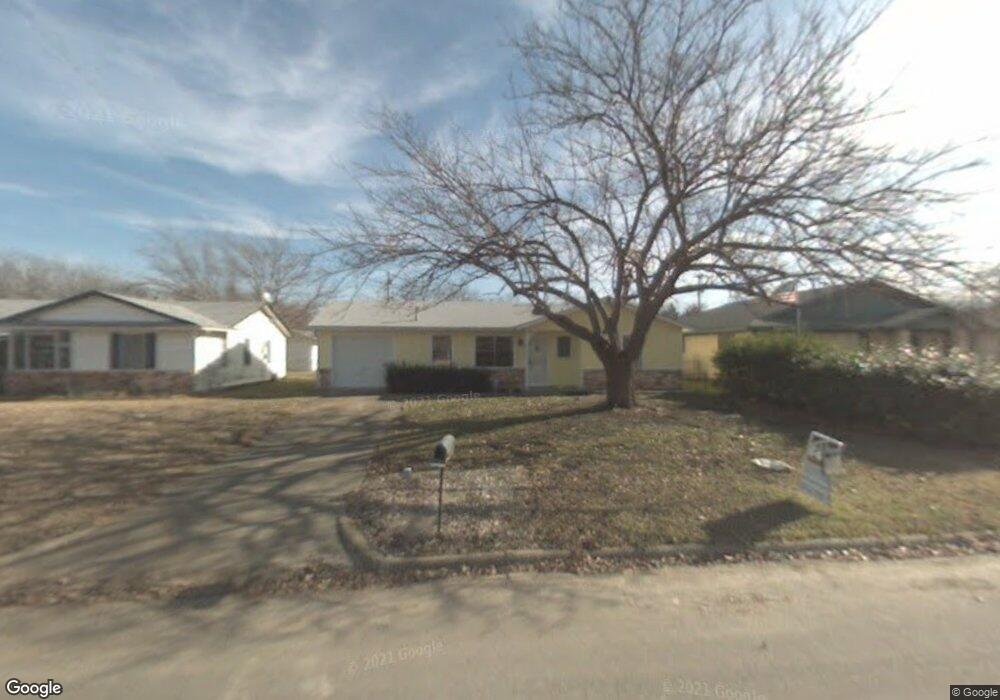
1121 N Brents Ave Sherman, TX 75090
Estimated Value: $153,000 - $158,494
3
Beds
2
Baths
1,018
Sq Ft
$153/Sq Ft
Est. Value
About This Home
This home is located at 1121 N Brents Ave, Sherman, TX 75090 and is currently estimated at $155,747, approximately $152 per square foot. 1121 N Brents Ave is a home located in Grayson County with nearby schools including Jefferson Elementary School, Piner Middle School, and Dillingham Intermediate School.
Ownership History
Date
Name
Owned For
Owner Type
Purchase Details
Closed on
Dec 19, 2012
Sold by
Miller Brandon
Bought by
Kickin As & Takin Land Llc
Current Estimated Value
Purchase Details
Closed on
Oct 17, 2012
Sold by
County Of Grayson
Bought by
Miller Brandon
Purchase Details
Closed on
Aug 1, 2008
Sold by
Gouard Dan and Gouard Linda
Bought by
Paulin Javier Leon and Paulin Veronica Garcia
Home Financials for this Owner
Home Financials are based on the most recent Mortgage that was taken out on this home.
Original Mortgage
$49,300
Interest Rate
6.4%
Mortgage Type
Seller Take Back
Purchase Details
Closed on
Jul 28, 2006
Sold by
Marsh Elmer E and Marsh Janice E
Bought by
Gouard Dan and Gouard Linda
Home Financials for this Owner
Home Financials are based on the most recent Mortgage that was taken out on this home.
Original Mortgage
$59,000
Interest Rate
6.66%
Mortgage Type
Purchase Money Mortgage
Create a Home Valuation Report for This Property
The Home Valuation Report is an in-depth analysis detailing your home's value as well as a comparison with similar homes in the area
Home Values in the Area
Average Home Value in this Area
Purchase History
| Date | Buyer | Sale Price | Title Company |
|---|---|---|---|
| Kickin As & Takin Land Llc | -- | None Available | |
| Miller Brandon | $1,500 | None Available | |
| Paulin Javier Leon | -- | None Available | |
| Gouard Dan | -- | Chapin Title Co Inc |
Source: Public Records
Mortgage History
| Date | Status | Borrower | Loan Amount |
|---|---|---|---|
| Previous Owner | Paulin Javier Leon | $49,300 | |
| Previous Owner | Gouard Dan | $59,000 |
Source: Public Records
Tax History Compared to Growth
Tax History
| Year | Tax Paid | Tax Assessment Tax Assessment Total Assessment is a certain percentage of the fair market value that is determined by local assessors to be the total taxable value of land and additions on the property. | Land | Improvement |
|---|---|---|---|---|
| 2025 | $3,256 | $146,062 | $54,180 | $91,882 |
| 2024 | $3,256 | $148,457 | $53,730 | $94,727 |
| 2023 | $801 | $93,508 | $0 | $0 |
| 2022 | $1,992 | $85,007 | $0 | $0 |
| 2021 | $1,937 | $106,199 | $26,100 | $80,099 |
| 2020 | $1,737 | $69,458 | $13,680 | $55,778 |
| 2019 | $1,621 | $64,956 | $10,170 | $54,786 |
| 2018 | $1,372 | $64,973 | $7,470 | $57,503 |
| 2017 | $1,238 | $49,715 | $5,310 | $44,405 |
| 2016 | $1,164 | $46,748 | $5,310 | $41,438 |
| 2015 | $724 | $46,946 | $5,310 | $41,636 |
| 2014 | $771 | $41,365 | $5,310 | $36,055 |
Source: Public Records
Map
Nearby Homes
- 1110 N Ross Ave
- 1511 N Brents Ave
- 13 E Lewis St
- 1 E Lewis St
- 5 E Lewis St
- 14 E Lewis St
- 2233 E Tuck St
- 1007 N Cleveland Ave
- 1416 N Cleveland Ave
- 1215 N Grand Ave
- 2239 E Tuck St
- 1721 N Hoard Ave
- 1915 E Cole Ave
- 716 N Harrison Ave
- TBD N Cleveland Ave
- 703 N Cleveland Ave
- 508 N Elliott St
- 417 N Burdette Ave
- 1705 E Hilton St
- 406 N Burdette Ave
- 1119 N Brents Ave
- 1201 N Brents Ave
- 1115 N Brents Ave
- 1205 N Brents Ave
- 1209 N Brents Ave
- 1109 N Brents Ave
- 1206 N Brents Ave
- 1122 N Brents Ave
- 1118 N Brents Ave
- 1213 N Brents Ave
- 1114 N Brents Ave
- 1110 N Brents Ave
- 1214 N Brents Ave
- 1106 N Brents Ave
- 1105 N Brents Ave
- 1218 N Brents Ave
- 1102 N Brents Ave
- 1201 N Ross Ave
- 1121 N Ross Ave
- 1207 N Ross Ave