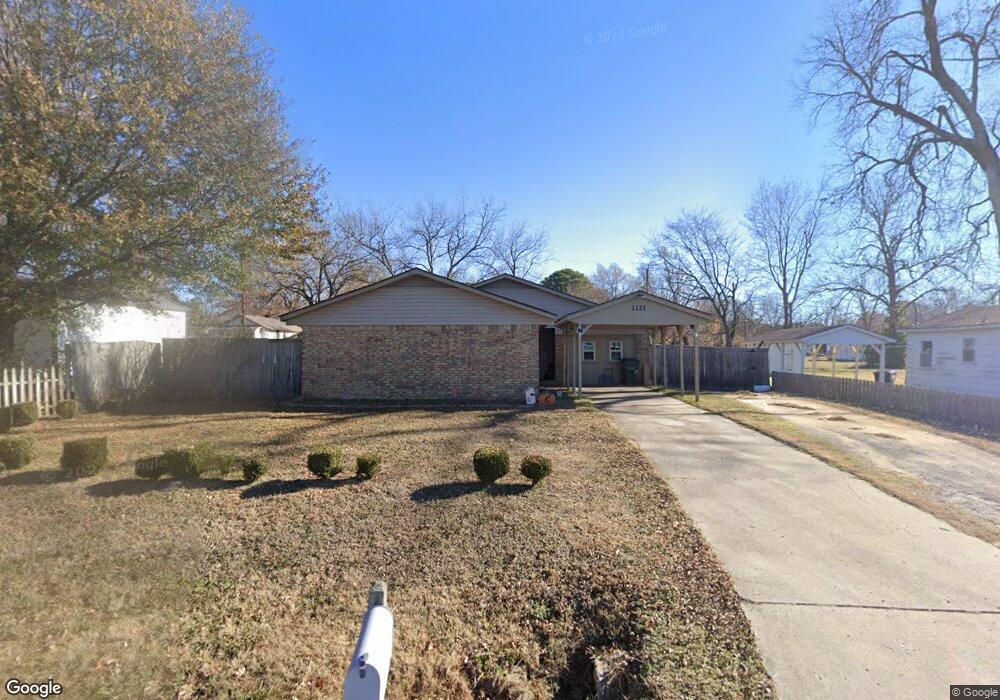
1121 N Kern Ave Okmulgee, OK 74447
Estimated Value: $91,000 - $202,000
3
Beds
2
Baths
1,272
Sq Ft
$101/Sq Ft
Est. Value
About This Home
This home is located at 1121 N Kern Ave, Okmulgee, OK 74447 and is currently estimated at $129,060, approximately $101 per square foot. 1121 N Kern Ave is a home located in Okmulgee County with nearby schools including Okmulgee Primary School, Okmulgee Middle School, and Dunbar Elementary School.
Ownership History
Date
Name
Owned For
Owner Type
Purchase Details
Closed on
Mar 6, 2017
Sold by
Jenkins Sharon and Chisholm Frank
Bought by
Chisholm Sharon L and Chisholm Frank E
Current Estimated Value
Home Financials for this Owner
Home Financials are based on the most recent Mortgage that was taken out on this home.
Original Mortgage
$38,825
Outstanding Balance
$1,727
Interest Rate
4.19%
Mortgage Type
Future Advance Clause Open End Mortgage
Estimated Equity
$127,333
Purchase Details
Closed on
Sep 12, 2014
Sold by
Autaubo Rebecca
Bought by
Jenkins Sharon and Jenkins Frank
Purchase Details
Closed on
May 12, 2005
Sold by
Autaubo Rebecca
Bought by
Litsey Dale E and Litsey Karen Collen
Create a Home Valuation Report for This Property
The Home Valuation Report is an in-depth analysis detailing your home's value as well as a comparison with similar homes in the area
Home Values in the Area
Average Home Value in this Area
Purchase History
| Date | Buyer | Sale Price | Title Company |
|---|---|---|---|
| Chisholm Sharon L | -- | None Available | |
| Jenkins Sharon | -- | -- | |
| Litsey Dale E | -- | None Available |
Source: Public Records
Mortgage History
| Date | Status | Borrower | Loan Amount |
|---|---|---|---|
| Open | Chisholm Sharon L | $38,825 |
Source: Public Records
Tax History Compared to Growth
Tax History
| Year | Tax Paid | Tax Assessment Tax Assessment Total Assessment is a certain percentage of the fair market value that is determined by local assessors to be the total taxable value of land and additions on the property. | Land | Improvement |
|---|---|---|---|---|
| 2025 | $284 | $4,100 | $315 | $3,785 |
| 2024 | $270 | $4,100 | $315 | $3,785 |
| 2023 | $243 | $3,864 | $315 | $3,549 |
| 2022 | $233 | $3,752 | $315 | $3,437 |
| 2021 | $234 | $3,752 | $315 | $3,437 |
| 2020 | $224 | $3,536 | $315 | $3,221 |
| 2019 | $215 | $3,433 | $315 | $3,118 |
| 2018 | $209 | $3,333 | $315 | $3,018 |
| 2017 | $198 | $3,236 | $315 | $2,921 |
| 2016 | $190 | $3,142 | $315 | $2,827 |
| 2015 | $303 | $3,518 | $315 | $3,203 |
| 2014 | $132 | $3,518 | $315 | $3,203 |
Source: Public Records
Map
Nearby Homes
- 1026 N Kern Ave
- 0 N Sherman Ave
- 813 N Kern Ave
- 1400 W Seneca St
- 1101 N Collins Ave
- 704 N Sherman Ave
- 1106 N Alabama Ave
- 700 N Sherman Ave
- 910 N Collins Ave
- 908 N Collins Ave
- 804 N Griffin Ave
- 1401 N Griffin St
- 804 N Alabama Ave
- 602 N Collins Ave
- 400 Yuchi Dr
- 530 N Okmulgee Ave
- 0096 State Highway 56
- 305 N Taft Ave
- 130 N Taft Ave
- 809 N Grand Ave
- 1117 N Kern Ave
- 1123 N Kern Ave
- 1120 W Melrose St
- 1118 N Sherman Ave
- 1128 N Sherman Ave
- 1107 N Kern Ave
- 1201 N Kern Ave
- 1101 N Kern Ave
- 1101 W Melrose St
- 1200 N Kern Ave
- 1203 N Kern Ave
- 1105 W Fairfax St
- 1117 N Sherman Ave
- 1208 N Sherman Ave
- 1103 N Sherman Ave
- 1205 N Kern Ave
- 1201 N Sherman Ave
- 1021 N Kern Ave
- 1106 W Fairfax St
- 1203 N Sherman Ave