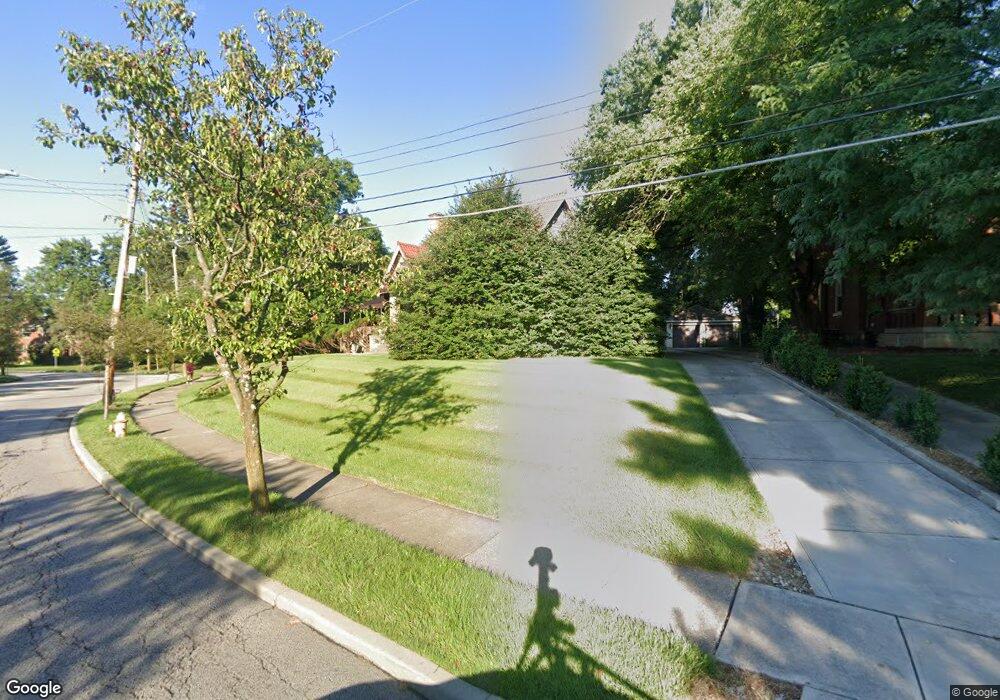
1121 Overlook Ave Cincinnati, OH 45238
West Price Hill NeighborhoodEstimated Value: $293,048 - $363,000
3
Beds
2
Baths
2,768
Sq Ft
$118/Sq Ft
Est. Value
About This Home
This home is located at 1121 Overlook Ave, Cincinnati, OH 45238 and is currently estimated at $325,512, approximately $117 per square foot. 1121 Overlook Ave is a home located in Hamilton County with nearby schools including Carson School, Gilbert A. Dater High School, and Western Hills High School.
Ownership History
Date
Name
Owned For
Owner Type
Purchase Details
Closed on
Jun 10, 2019
Sold by
Heyob Angela
Bought by
Stewart Bruce G
Current Estimated Value
Purchase Details
Closed on
Jun 16, 2006
Sold by
Predmore Constance L and Predmore Dennis R
Bought by
Heybo Angela
Home Financials for this Owner
Home Financials are based on the most recent Mortgage that was taken out on this home.
Original Mortgage
$100,000
Interest Rate
6.72%
Mortgage Type
Unknown
Purchase Details
Closed on
May 30, 2003
Sold by
Mersmann Mark A and Mersmann Tina R
Bought by
Predmore Dennis R and Predmore Constance L
Home Financials for this Owner
Home Financials are based on the most recent Mortgage that was taken out on this home.
Original Mortgage
$100,000
Interest Rate
5.88%
Mortgage Type
Unknown
Create a Home Valuation Report for This Property
The Home Valuation Report is an in-depth analysis detailing your home's value as well as a comparison with similar homes in the area
Home Values in the Area
Average Home Value in this Area
Purchase History
| Date | Buyer | Sale Price | Title Company |
|---|---|---|---|
| Stewart Bruce G | $141,660 | None Available | |
| Heybo Angela | -- | Landamerica | |
| Predmore Dennis R | $198,500 | Advanced Land Title Agency L |
Source: Public Records
Mortgage History
| Date | Status | Borrower | Loan Amount |
|---|---|---|---|
| Previous Owner | Heybo Angela | $100,000 | |
| Previous Owner | Predmore Dennis R | $100,000 |
Source: Public Records
Tax History
| Year | Tax Paid | Tax Assessment Tax Assessment Total Assessment is a certain percentage of the fair market value that is determined by local assessors to be the total taxable value of land and additions on the property. | Land | Improvement |
|---|---|---|---|---|
| 2025 | $5,265 | $84,767 | $9,779 | $74,988 |
| 2024 | $5,110 | $84,767 | $9,779 | $74,988 |
| 2023 | $5,222 | $84,767 | $9,779 | $74,988 |
| 2022 | $3,760 | $54,541 | $9,779 | $44,762 |
| 2021 | $3,609 | $54,541 | $9,779 | $44,762 |
| 2020 | $3,711 | $54,541 | $9,779 | $44,762 |
| 2019 | $3,815 | $49,581 | $8,890 | $40,691 |
| 2018 | $3,818 | $49,581 | $8,890 | $40,691 |
| 2017 | $3,676 | $49,581 | $8,890 | $40,691 |
| 2016 | $3,997 | $52,630 | $9,531 | $43,099 |
| 2015 | $3,575 | $52,630 | $9,531 | $43,099 |
| 2014 | $3,594 | $52,630 | $9,531 | $43,099 |
| 2013 | $4,149 | $59,805 | $10,829 | $48,976 |
Source: Public Records
Map
Nearby Homes
- 4764 Dale Ave
- 1086 Benz Ave
- 1059 Lockman Ave
- 4758 Glenway Ave
- 815 Pedretti Ave
- 1092 Morado Dr
- 4458 W 8th St
- 4419 Ridgeview Ave
- 4965 Glenway Ave
- 4526 Clearview Ave
- 4614 Midland Ave
- 1141 Covedale Ave
- 4340 Eighth St W
- 4334 W 8th St
- 1026 Schiff Ave
- 4318 Eighth St W
- 5114 Cleves Warsaw Pike
- 5152 Highview Dr
- 4915 Heuwerth Ave
- 5140 Willnet Dr
- 1125 Overlook Ave
- 1112 Rulison Ave
- 1116 Rulison Ave
- 1110 Rulison Ave
- 1117 Overlook Ave
- 1118 Rulison Ave
- 1135 Overlook Ave
- 1104 Overlook Ave
- 1122 Rulison Ave
- 1120 Overlook Ave
- 1126 Rulison Ave
- 1103 Overlook Ave
- 1139 Overlook Ave
- 1124 Overlook Ave
- 1130 Rulison Ave
- 1134 Rulison Ave
- 4782 Loretta Ave
- 1132 Overlook Ave
- 1138 Rulison Ave
- 1119 Rulison Ave
Your Personal Tour Guide
Ask me questions while you tour the home.