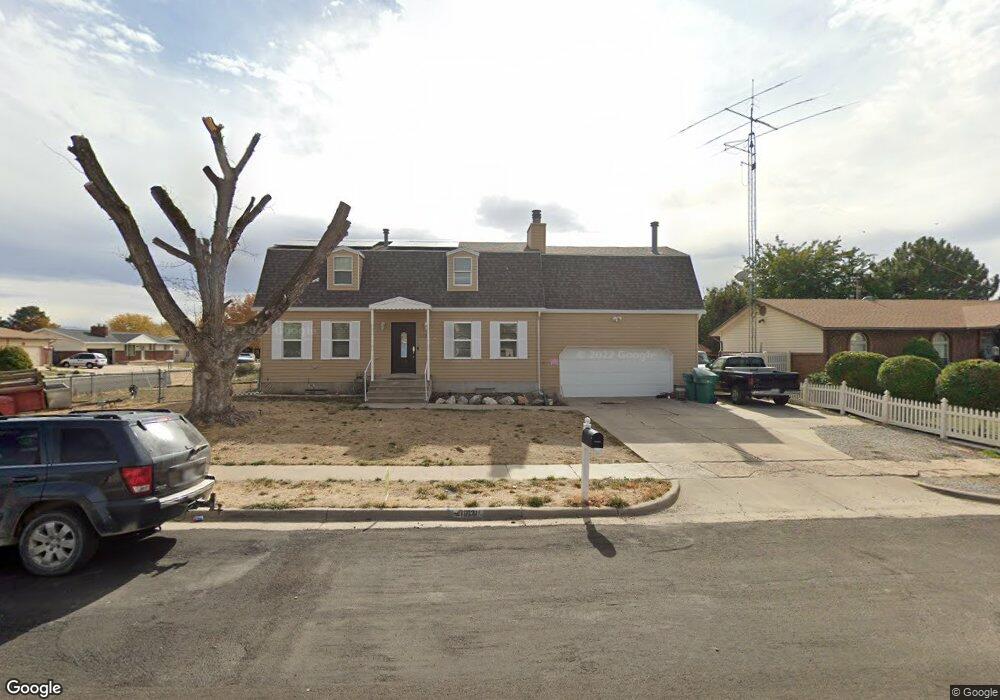
1121 W 200 N Clearfield, UT 84015
Estimated Value: $512,000 - $540,000
7
Beds
2
Baths
3,782
Sq Ft
$140/Sq Ft
Est. Value
About This Home
This home is located at 1121 W 200 N, Clearfield, UT 84015 and is currently estimated at $528,237, approximately $139 per square foot. 1121 W 200 N is a home located in Davis County with nearby schools including Holt Elementary School, North Davis Junior High School, and Syracuse High School.
Ownership History
Date
Name
Owned For
Owner Type
Purchase Details
Closed on
Jul 20, 2005
Sold by
Howe Jerry and Howe Jerry W
Bought by
Howe Jerry W and Howe Mikal D
Current Estimated Value
Home Financials for this Owner
Home Financials are based on the most recent Mortgage that was taken out on this home.
Original Mortgage
$24,000
Interest Rate
5.05%
Mortgage Type
Stand Alone Second
Purchase Details
Closed on
Oct 29, 1998
Sold by
Johnson Jay H
Bought by
Johnson Jay H and Johnson Kathlene
Purchase Details
Closed on
Oct 24, 1997
Sold by
Johnson Jay H
Bought by
Johnson Jay H
Home Financials for this Owner
Home Financials are based on the most recent Mortgage that was taken out on this home.
Original Mortgage
$100,000
Interest Rate
6.93%
Create a Home Valuation Report for This Property
The Home Valuation Report is an in-depth analysis detailing your home's value as well as a comparison with similar homes in the area
Home Values in the Area
Average Home Value in this Area
Purchase History
| Date | Buyer | Sale Price | Title Company |
|---|---|---|---|
| Howe Jerry W | -- | Backman Title Services | |
| Howe Jerry | -- | Equity Title Ins Agency Inc | |
| Johnson Jay H | -- | -- | |
| Johnson Jay H | -- | Inwest Title Services Inc |
Source: Public Records
Mortgage History
| Date | Status | Borrower | Loan Amount |
|---|---|---|---|
| Closed | Howe Jerry | $24,000 | |
| Open | Howe Jerry | $131,120 | |
| Previous Owner | Johnson Jay H | $100,000 |
Source: Public Records
Tax History Compared to Growth
Tax History
| Year | Tax Paid | Tax Assessment Tax Assessment Total Assessment is a certain percentage of the fair market value that is determined by local assessors to be the total taxable value of land and additions on the property. | Land | Improvement |
|---|---|---|---|---|
| 2025 | -- | $298,100 | $69,835 | $228,265 |
| 2024 | $332 | $288,750 | $66,756 | $221,994 |
| 2023 | $332 | $491,000 | $106,716 | $384,284 |
| 2022 | $1,656 | $290,400 | $61,011 | $229,389 |
| 2021 | $2,836 | $384,000 | $65,229 | $318,771 |
| 2020 | $2,573 | $346,000 | $54,945 | $291,055 |
| 2019 | $2,418 | $321,000 | $57,257 | $263,743 |
| 2018 | $2,158 | $279,000 | $50,666 | $228,334 |
| 2016 | $1,770 | $119,680 | $20,383 | $99,297 |
| 2015 | $1,511 | $97,405 | $20,383 | $77,022 |
| 2014 | $1,416 | $92,510 | $20,383 | $72,127 |
| 2013 | -- | $111,517 | $30,096 | $81,421 |
Source: Public Records
Map
Nearby Homes
- 303 N Canterbury Way
- 16 N 1300 W
- 417 N 1200 W Unit 84
- 423 N 1250 W Unit 118
- Evergreen Plan at Ivie Meadows
- 274 N 825 W
- 288 N 825 W
- 777 W 300 N
- 1337 W 550 N Unit 195
- 575 N 1350 W Unit 137
- 762 W 300 N
- 563 N 1350 W Unit 139
- 1350 W 300 N Unit 49
- 1350 W 300 N Unit 38
- 1350 W 300 N Unit 29
- 620 N 1100 W
- 232 N Rick Way
- 135 S 1525 W
- 4284 W 350 S Unit 615
- 4296 W 350 S Unit 614