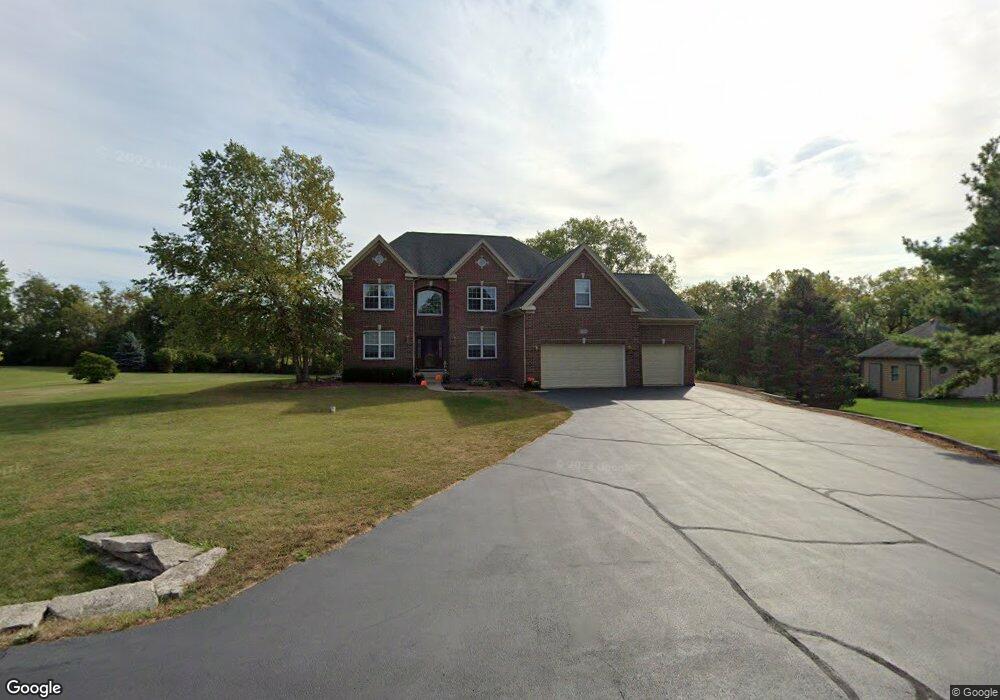
11212 Hill Crest Ln Marengo, IL 60152
Riley NeighborhoodEstimated Value: $561,075 - $654,000
4
Beds
3
Baths
3,417
Sq Ft
$178/Sq Ft
Est. Value
About This Home
This home is located at 11212 Hill Crest Ln, Marengo, IL 60152 and is currently estimated at $608,269, approximately $178 per square foot. 11212 Hill Crest Ln is a home located in McHenry County with nearby schools including Riley Community Consolidated School District 18 and Marengo Community High School.
Ownership History
Date
Name
Owned For
Owner Type
Purchase Details
Closed on
Sep 19, 2019
Sold by
Chicago Title Land Trust Company
Bought by
Corbel Raymond J and Corbel Virginia M
Current Estimated Value
Purchase Details
Closed on
Dec 7, 2015
Sold by
Corbel Raymond J and Corbel Helen Mandas
Bought by
Harris Na and Trust #Htn 3311
Purchase Details
Closed on
Sep 10, 2007
Sold by
Corbel Raymond J
Bought by
Harris Na and Trust #Htn 3311
Purchase Details
Closed on
Apr 27, 2006
Sold by
Schnellbaecher Mark
Bought by
Corbel Raymond
Purchase Details
Closed on
Jun 14, 2004
Sold by
Duffy Pamela A
Bought by
Schnellbaecher Mark
Purchase Details
Closed on
Jun 9, 2003
Sold by
Duffy Gavin J
Bought by
Duffy Pamela A
Purchase Details
Closed on
Aug 30, 2001
Sold by
Hill Charles O
Bought by
Duffy Gavin J and Duffy Pamela A
Purchase Details
Closed on
May 4, 1999
Sold by
Hill Charles O
Bought by
Hill Charles O and Maude Hill Trust
Create a Home Valuation Report for This Property
The Home Valuation Report is an in-depth analysis detailing your home's value as well as a comparison with similar homes in the area
Home Values in the Area
Average Home Value in this Area
Purchase History
| Date | Buyer | Sale Price | Title Company |
|---|---|---|---|
| Corbel Raymond J | -- | Chicago Title Land Trust Co | |
| Harris Na | -- | Chicago Title Insurance Co | |
| Harris Na | -- | None Available | |
| Corbel Raymond | $500,000 | First United Title Svcs Inc | |
| Schnellbaecher Mark | $120,000 | Multiple | |
| Duffy Pamela A | -- | -- | |
| Duffy Gavin J | $90,000 | Lawyers Title Insurance Corp | |
| Hill Charles O | -- | -- |
Source: Public Records
Tax History Compared to Growth
Tax History
| Year | Tax Paid | Tax Assessment Tax Assessment Total Assessment is a certain percentage of the fair market value that is determined by local assessors to be the total taxable value of land and additions on the property. | Land | Improvement |
|---|---|---|---|---|
| 2024 | $6,627 | $145,531 | $18,021 | $127,510 |
| 2023 | $8,249 | $131,607 | $16,297 | $115,310 |
| 2022 | $9,789 | $137,390 | $21,830 | $115,560 |
| 2021 | $6,997 | $129,552 | $20,585 | $108,967 |
| 2020 | $9,603 | $126,208 | $20,054 | $106,154 |
| 2019 | $10,248 | $120,750 | $19,187 | $101,563 |
| 2018 | $10,372 | $123,146 | $26,216 | $96,930 |
| 2017 | $10,170 | $118,856 | $25,303 | $93,553 |
| 2016 | $10,037 | $114,328 | $24,339 | $89,989 |
| 2013 | -- | $110,625 | $22,930 | $87,695 |
Source: Public Records
Map
Nearby Homes
- 10817 Hill Crest Ln
- LOT 3 Henry St
- Lot 4 Henry St
- 0 Church Rd Unit MRD12107441
- 18609 Pinon Trail
- 10509 Henning Dr
- 10415 Henning Dr
- 10502 Henning Dr
- 10701 Clearwater Way
- 10705 Clearwater Way
- 10408 Henning Dr
- 10702 Clearwater Way
- 10006 Saint Andrews Dr
- 10309 Ellery Ln
- 9814 Saint Andrews Dr
- 10201 Henning Dr
- 9805 Saint Andrews Dr
- 10208 Henning Dr
- 10108 Henning Dr
- 10410 Oakdale Dr
- 11206 Hill Crest Ln
- 11220 Hill Crest Ln
- 108117 Hillcrest Ln
- 11211 Hill Crest Ln
- 11217 Hill Crest Ln
- 11217 Hill Crest Ln
- 11116 Hill Crest Ln
- 11202 Hill Crest Ln
- 11115 Hill Crest Ln
- 11103 Hill Crest Ln
- 11011 Hill Crest Ln
- 10917 Hill Crest Ln
- 17910 Harmony Rd
- 10916 Hill Crest Ln
- 17816 Harmony Rd
- 10910 Hill Crest Ln
- 10911 Hill Crest Ln
- 10904 Hill Crest Ln
- 17907 Harmony Rd
- 17807 Harmony Rd