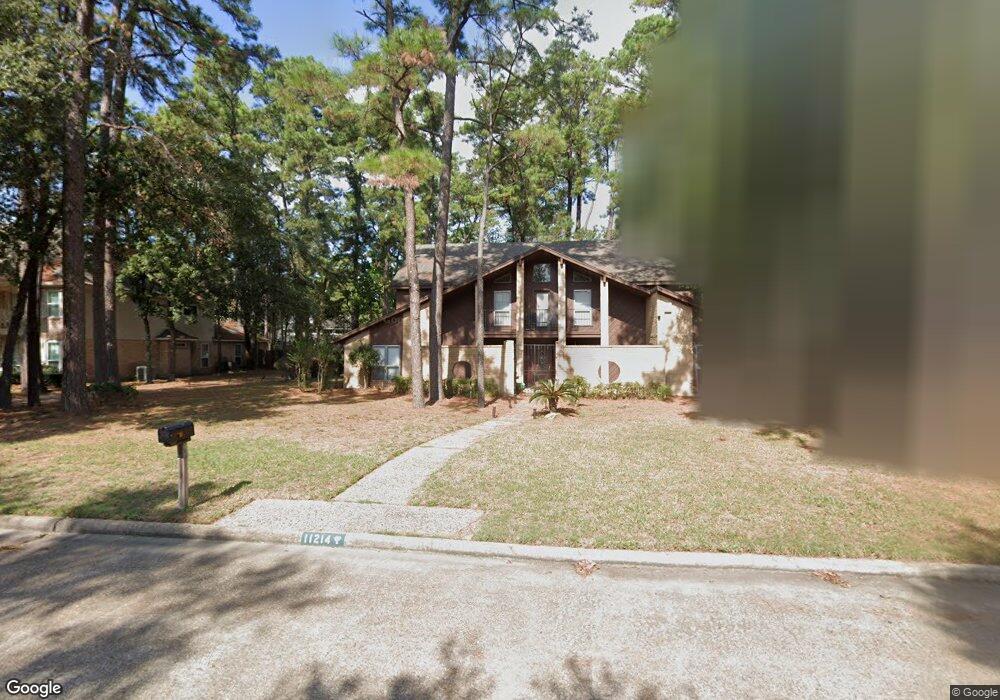
11214 Lorton Dr Houston, TX 77070
Estimated Value: $503,754 - $542,000
4
Beds
4
Baths
3,585
Sq Ft
$144/Sq Ft
Est. Value
About This Home
This home is located at 11214 Lorton Dr, Houston, TX 77070 and is currently estimated at $517,939, approximately $144 per square foot. 11214 Lorton Dr is a home located in Harris County with nearby schools including Lakewood Elementary School, Willow Wood Junior High School, and Northpointe Intermediate School.
Ownership History
Date
Name
Owned For
Owner Type
Purchase Details
Closed on
Jun 10, 2013
Sold by
Kiser Deborah Lynn
Bought by
Chang Chi-Chia
Current Estimated Value
Purchase Details
Closed on
Aug 31, 2006
Sold by
Aurora Loan Services Llc
Bought by
Chang Chi Chia
Purchase Details
Closed on
Feb 7, 2006
Sold by
Mortgage Electronic Registration Systems
Bought by
Aurora Loan Services Llc
Purchase Details
Closed on
Dec 15, 2004
Sold by
Strong Brooks Lee and Strong Lori
Bought by
Parker Belinda
Home Financials for this Owner
Home Financials are based on the most recent Mortgage that was taken out on this home.
Original Mortgage
$218,400
Interest Rate
7.65%
Mortgage Type
Purchase Money Mortgage
Create a Home Valuation Report for This Property
The Home Valuation Report is an in-depth analysis detailing your home's value as well as a comparison with similar homes in the area
Home Values in the Area
Average Home Value in this Area
Purchase History
| Date | Buyer | Sale Price | Title Company |
|---|---|---|---|
| Chang Chi-Chia | -- | Chicago Title | |
| Chang Chi Chia | -- | Fidelity National Title #11 | |
| Aurora Loan Services Llc | -- | None Available | |
| Mortgage Electronic Registration Systems | $210,000 | None Available | |
| Parker Belinda | -- | Reliable Title Company |
Source: Public Records
Mortgage History
| Date | Status | Borrower | Loan Amount |
|---|---|---|---|
| Previous Owner | Parker Belinda | $218,400 | |
| Closed | Parker Belinda | $54,600 |
Source: Public Records
Tax History Compared to Growth
Tax History
| Year | Tax Paid | Tax Assessment Tax Assessment Total Assessment is a certain percentage of the fair market value that is determined by local assessors to be the total taxable value of land and additions on the property. | Land | Improvement |
|---|---|---|---|---|
| 2025 | $4,097 | $542,704 | $99,932 | $442,772 |
| 2024 | $4,097 | $521,361 | $85,791 | $435,570 |
| 2023 | $4,097 | $503,028 | $81,077 | $421,951 |
| 2022 | $10,365 | $463,678 | $73,535 | $390,143 |
| 2021 | $9,940 | $398,500 | $56,565 | $341,935 |
| 2020 | $9,870 | $381,207 | $56,565 | $324,642 |
| 2019 | $9,381 | $354,858 | $52,040 | $302,818 |
| 2018 | $2,162 | $218,316 | $56,565 | $161,751 |
| 2017 | $9,209 | $346,900 | $56,565 | $290,335 |
| 2016 | $8,503 | $346,900 | $56,565 | $290,335 |
| 2015 | $6,385 | $346,900 | $56,565 | $290,335 |
| 2014 | $6,385 | $264,728 | $56,565 | $208,163 |
Source: Public Records
Map
Nearby Homes
- 12 Lakeview Place
- 15206 Beacham Dr
- 11410 Rothglen St
- 11502 Primwood Dr
- 11723 Quail Creek Dr
- 14907 Pine Point Ct
- 15118 Stillcreek Dr
- 11515 Normont Dr
- 11614 Brookfalls Dr
- 11807 Primwood Dr
- 11715 Park Creek Dr
- 11803 Pebbleton Dr
- 11707 Hillbrook Dr
- 15102 Rolling Oaks Dr
- 10822 Normont Dr
- 11607 Knobcrest Dr
- 13911 Cypresswood Crossing Blvd
- 11814 Golden Pine Dr
- 15603 Canterbury Forest Dr
- 15014 River Park Dr
- 11210 Lorton Dr
- 11218 Lorton Dr
- 11211 Patridge Dr
- 11215 Patridge Dr
- 11207 Patridge Dr
- 11215 Lorton Dr
- 11211 Lorton Dr
- 11206 Lorton Dr
- 11203 Patridge Dr
- 11202 Lorton Dr
- 11207 Lorton Dr
- 15011 Jones Rd
- 11210 Patridge Dr
- 11214 Patridge Dr
- 11203 Lorton Dr
- 15007 Jones Rd
- 15015 Jones Rd
- 15102 Beacham Dr
- 15003 Jones Rd
- 15019 Jones Rd