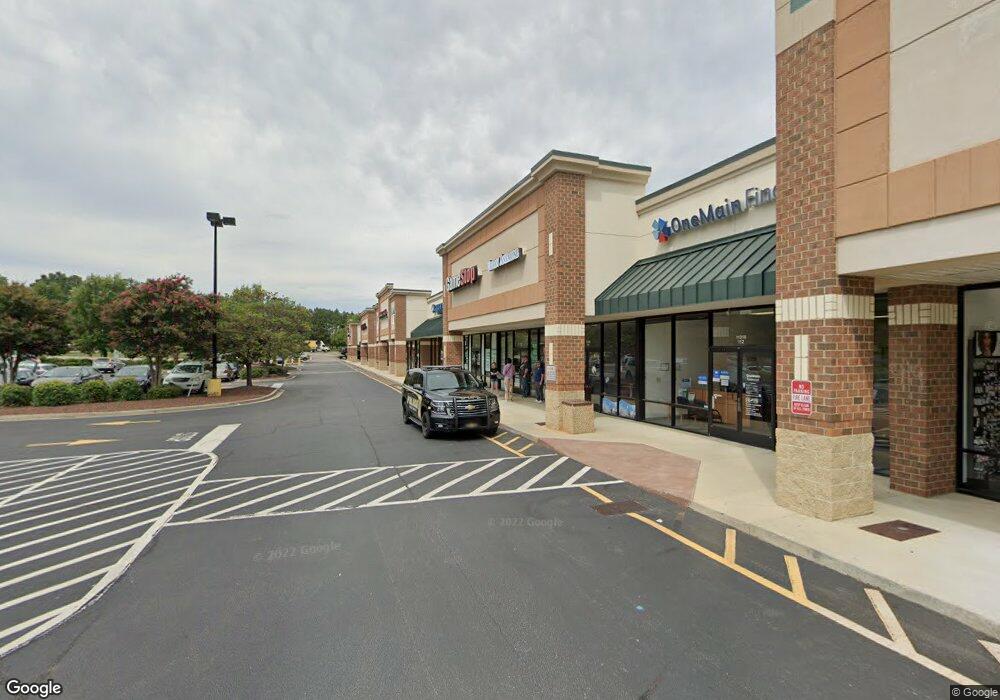
11216 Capital Blvd Wake Forest, NC 27587
Estimated Value: $17,944,530
--
Bed
--
Bath
38,750
Sq Ft
$463/Sq Ft
Est. Value
About This Home
This home is located at 11216 Capital Blvd, Wake Forest, NC 27587 and is currently estimated at $17,944,530, approximately $463 per square foot. 11216 Capital Blvd is a home located in Wake County with nearby schools including Forest Pines Drive Elementary School, Wake Forest-Rolesville Middle School, and Heritage High School.
Ownership History
Date
Name
Owned For
Owner Type
Purchase Details
Closed on
Jan 23, 2015
Sold by
Wilson Investment Properties Inc
Bought by
Wake Pointe Wip Llc
Current Estimated Value
Home Financials for this Owner
Home Financials are based on the most recent Mortgage that was taken out on this home.
Original Mortgage
$3,300,000
Outstanding Balance
$2,536,951
Interest Rate
3.94%
Mortgage Type
Commercial
Estimated Equity
$15,407,579
Purchase Details
Closed on
Oct 28, 2005
Sold by
Wake Forest Shop Space Lp
Bought by
Wilson Investment Properties Inc
Purchase Details
Closed on
Feb 28, 2005
Sold by
Wr Of Wake Forest Llc
Bought by
Wake Forest Shop Space Lp
Home Financials for this Owner
Home Financials are based on the most recent Mortgage that was taken out on this home.
Original Mortgage
$4,300,000
Interest Rate
5.54%
Mortgage Type
Commercial
Create a Home Valuation Report for This Property
The Home Valuation Report is an in-depth analysis detailing your home's value as well as a comparison with similar homes in the area
Home Values in the Area
Average Home Value in this Area
Purchase History
| Date | Buyer | Sale Price | Title Company |
|---|---|---|---|
| Wake Pointe Wip Llc | -- | None Available | |
| Wilson Investment Properties Inc | $6,850,000 | None Available | |
| Wake Forest Shop Space Lp | $5,475,500 | -- |
Source: Public Records
Mortgage History
| Date | Status | Borrower | Loan Amount |
|---|---|---|---|
| Open | Wake Pointe Wip Llc | $3,300,000 | |
| Previous Owner | Wake Forest Shop Space Lp | $4,300,000 |
Source: Public Records
Tax History Compared to Growth
Tax History
| Year | Tax Paid | Tax Assessment Tax Assessment Total Assessment is a certain percentage of the fair market value that is determined by local assessors to be the total taxable value of land and additions on the property. | Land | Improvement |
|---|---|---|---|---|
| 2025 | $88,303 | $8,615,460 | $1,115,737 | $7,499,723 |
| 2024 | $99,848 | $9,885,338 | $1,115,737 | $8,769,601 |
| 2023 | $73,757 | $6,347,428 | $929,781 | $5,417,647 |
| 2022 | $70,742 | $6,347,428 | $929,781 | $5,417,647 |
| 2021 | $69,504 | $6,347,428 | $929,781 | $5,417,647 |
| 2020 | $77,964 | $7,119,979 | $929,781 | $6,190,198 |
| 2019 | $97,611 | $7,867,384 | $1,431,273 | $6,436,111 |
| 2018 | $92,395 | $7,867,384 | $1,431,273 | $6,436,111 |
| 2017 | $89,295 | $7,867,384 | $1,431,273 | $6,436,111 |
| 2016 | $88,154 | $7,867,384 | $1,431,273 | $6,436,111 |
| 2015 | $57,943 | $5,107,350 | $1,893,218 | $3,214,132 |
| 2014 | $56,079 | $5,107,350 | $1,893,218 | $3,214,132 |
Source: Public Records
Map
Nearby Homes
- 11710 Mezzanine Dr Unit 111
- 11720 Mezzanine Dr Unit 103
- 122 Alberbury Commons Ct
- 1758 Rowsby Ct
- 403 Belgian Red Way
- 407 Belgian Red Way
- 409 Belgian Red Way
- 413 Belgian Red Way
- 414 Belgian Red Way
- 415 Belgian Red Way
- 416 Belgian Red Way
- 417 Belgian Red Way
- 419 Belgian Red Way
- 420 Belgian Red Way
- 423 Belgian Red Way
- 425 Belgian Red Way
- 427 Belgian Red Way
- 429 Belgian Red Way
- 413 Longbourn Dr
- 936 Blue Bird Ln
- 11220 Capital Blvd
- 11200 Capital Blvd
- 11300 Capital Blvd
- 11410 Common Oaks Dr
- 11201 Tidewater Ln
- 11201 Capital Blvd
- 11550 Common Oaks Dr
- 2126 S Main St Unit 386
- 2126 S Main St Unit 380
- 2126 S Main St Unit 379
- 11370 Common Oaks Dr Unit 114
- 11370 Common Oaks Dr
- 2014 S Main St Unit 612
- 2014 S Main St Unit 602
- 2014 S Main St Unit 604
- 2014 S Main St Unit 606
- 2014 S Main St Unit 600
- 2020 S Main St
- 00 Capcom Ave
- 2018 S Main St Unit 804