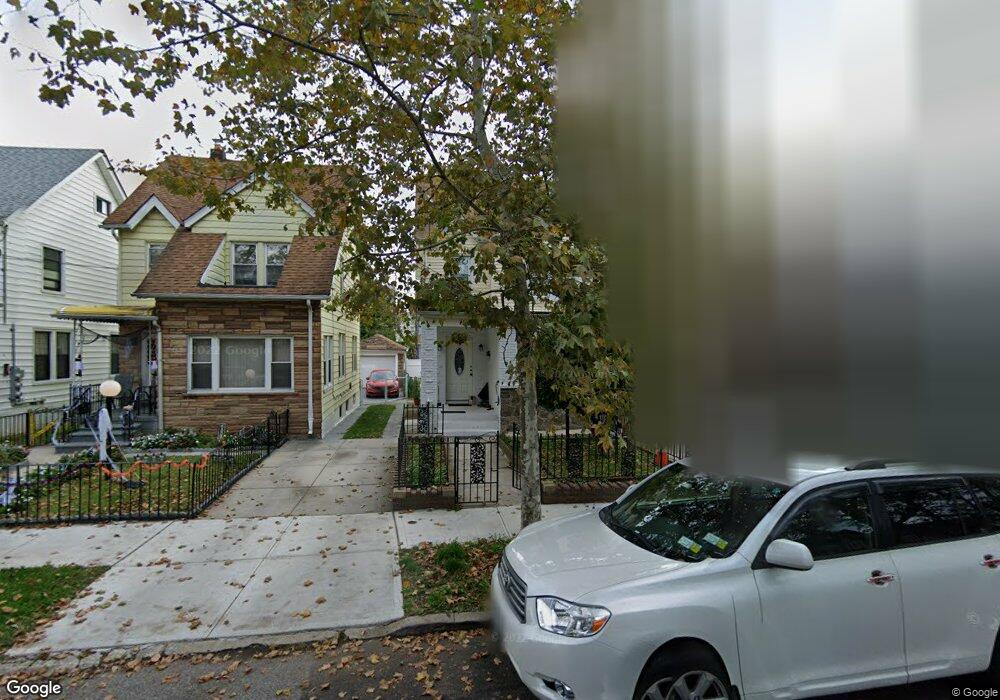
11217 197th St Saint Albans, NY 11412
Hollis NeighborhoodEstimated Value: $647,000 - $764,000
3
Beds
2
Baths
1,484
Sq Ft
$484/Sq Ft
Est. Value
About This Home
This home is located at 11217 197th St, Saint Albans, NY 11412 and is currently estimated at $718,115, approximately $483 per square foot. 11217 197th St is a home located in Queens County with nearby schools including P.S. 136 Roy Wilkins, I.S. 192 The Linden, and True Deliverance Christian School.
Ownership History
Date
Name
Owned For
Owner Type
Purchase Details
Closed on
Sep 26, 2022
Sold by
187-06 119 Dr Llc
Bought by
Meerza Azam and Meerza Kalawattie R
Current Estimated Value
Home Financials for this Owner
Home Financials are based on the most recent Mortgage that was taken out on this home.
Original Mortgage
$702,075
Outstanding Balance
$674,892
Interest Rate
5.89%
Mortgage Type
Purchase Money Mortgage
Estimated Equity
$43,223
Purchase Details
Closed on
Jan 7, 2022
Sold by
Hardial Anita and Virnan Nadia
Bought by
187-06 119 Dr Llc
Home Financials for this Owner
Home Financials are based on the most recent Mortgage that was taken out on this home.
Original Mortgage
$450,000
Interest Rate
3.56%
Mortgage Type
Purchase Money Mortgage
Purchase Details
Closed on
Mar 20, 2020
Sold by
Mattone Esq As Referee Irene
Bought by
Hardial Anita and Virnan Nadia
Create a Home Valuation Report for This Property
The Home Valuation Report is an in-depth analysis detailing your home's value as well as a comparison with similar homes in the area
Home Values in the Area
Average Home Value in this Area
Purchase History
| Date | Buyer | Sale Price | Title Company |
|---|---|---|---|
| Meerza Azam | $730,000 | -- | |
| Meerza Azam | $730,000 | -- | |
| 187-06 119 Dr Llc | $430,000 | -- | |
| 187-06 119 Dr Llc | $430,000 | -- | |
| Hardial Anita | $400,000 | -- | |
| Hardial Anita | $400,000 | -- |
Source: Public Records
Mortgage History
| Date | Status | Borrower | Loan Amount |
|---|---|---|---|
| Open | Meerza Azam | $702,075 | |
| Closed | Meerza Azam | $702,075 | |
| Previous Owner | 187-06 119 Dr Llc | $450,000 |
Source: Public Records
Tax History Compared to Growth
Tax History
| Year | Tax Paid | Tax Assessment Tax Assessment Total Assessment is a certain percentage of the fair market value that is determined by local assessors to be the total taxable value of land and additions on the property. | Land | Improvement |
|---|---|---|---|---|
| 2025 | $5,332 | $26,749 | $7,880 | $18,869 |
| 2024 | $4,265 | $26,546 | $8,801 | $17,745 |
| 2023 | $5,030 | $25,044 | $7,906 | $17,138 |
| 2022 | $4,717 | $31,980 | $11,100 | $20,880 |
| 2021 | $4,691 | $33,900 | $11,100 | $22,800 |
| 2020 | $4,718 | $31,860 | $11,100 | $20,760 |
| 2019 | $4,628 | $29,520 | $11,100 | $18,420 |
| 2018 | $4,254 | $20,870 | $8,855 | $12,015 |
| 2017 | $4,014 | $19,689 | $8,471 | $11,218 |
| 2016 | $3,713 | $19,689 | $8,471 | $11,218 |
| 2015 | $2,240 | $18,576 | $9,046 | $9,530 |
| 2014 | $2,240 | $18,435 | $9,762 | $8,673 |
Source: Public Records
Map
Nearby Homes
- 112-28 199th St
- 11132 199th St
- 194-29 112th Ave
- 194- 24 111th Rd
- 113-40 198th St
- 194-16 112th Ave
- 19432 113th Rd
- 19445 Murdock Ave
- 194-56 Murdock Ave
- 19427 Murdock Ave
- 190-63 112th Ave
- 194-42 Murdock Ave
- 190-59 112th Ave
- 114-22 197th St
- 114-28 198th St
- 191-40 112th Rd
- 114-11 200th St
- 19404 110th Rd
- 19431 114th Rd
- 114-37 199th St
- 11215 197th St
- 112-11 197th St
- 11211 197th St
- 112-17 197th St
- 11221 197th St
- 11221 197th St
- 11223 197th St
- 19706 112th Ave
- 11216 198th St
- 19702 112th Ave
- 11218 198th St
- 11212 198th St
- 19710 112th Ave
- 11222 198th St
- 11212 198th St
- 11227 197th St
- 112-28 197th St
- 19714 112th Ave
- 11224 198th St
- 112-18 198th St