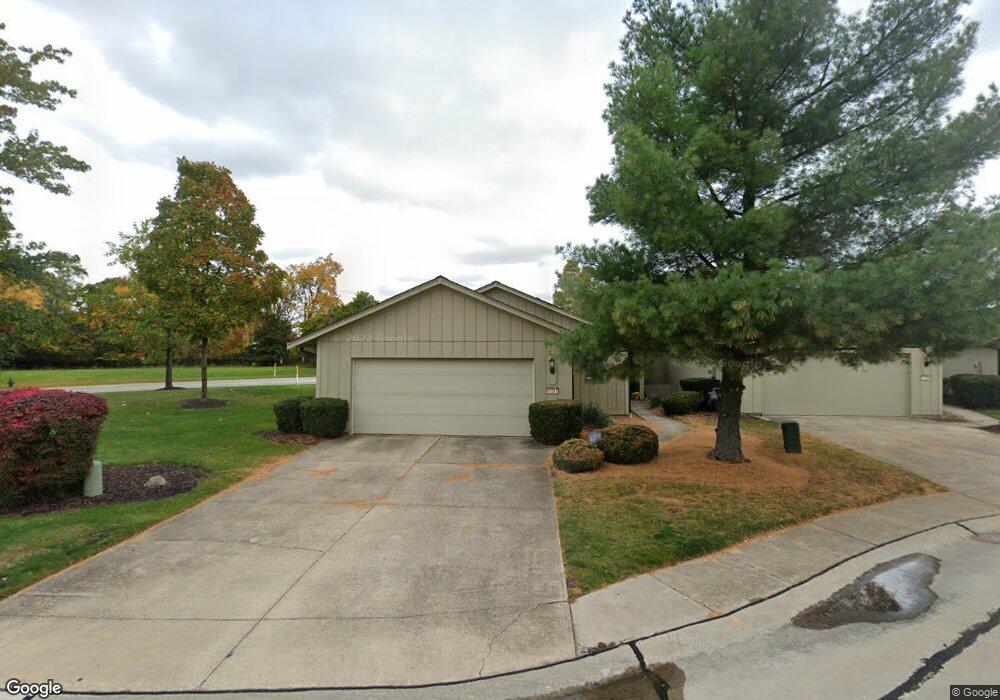
11217 Co Moor Blvd Strongsville, OH 44149
Estimated Value: $248,000 - $299,000
3
Beds
2
Baths
1,652
Sq Ft
$168/Sq Ft
Est. Value
About This Home
This home is located at 11217 Co Moor Blvd, Strongsville, OH 44149 and is currently estimated at $278,034, approximately $168 per square foot. 11217 Co Moor Blvd is a home located in Cuyahoga County with nearby schools including Strongsville High School and Sts Joseph & John Interparochial School.
Ownership History
Date
Name
Owned For
Owner Type
Purchase Details
Closed on
Oct 2, 2013
Sold by
Mounts Joan M and Catalano Joan M
Bought by
Catalano Joan M and Catalano Thomas J
Current Estimated Value
Purchase Details
Closed on
Apr 10, 1996
Sold by
Morell Dan A
Bought by
Mounts James W and Mounts Joan
Home Financials for this Owner
Home Financials are based on the most recent Mortgage that was taken out on this home.
Original Mortgage
$69,000
Interest Rate
6.91%
Mortgage Type
New Conventional
Purchase Details
Closed on
Jan 8, 1993
Sold by
David Violet A
Bought by
Morell Dan A
Purchase Details
Closed on
Nov 20, 1990
Sold by
Parker Mary A
Bought by
David Violet A
Purchase Details
Closed on
Jul 11, 1986
Sold by
Parker Mary A
Bought by
Parker Mary A
Purchase Details
Closed on
Jan 1, 1986
Bought by
Parker Mary A
Create a Home Valuation Report for This Property
The Home Valuation Report is an in-depth analysis detailing your home's value as well as a comparison with similar homes in the area
Home Values in the Area
Average Home Value in this Area
Purchase History
| Date | Buyer | Sale Price | Title Company |
|---|---|---|---|
| Catalano Joan M | -- | Attorney | |
| Mounts James W | $135,500 | -- | |
| Morell Dan A | $83,000 | -- | |
| David Violet A | -- | -- | |
| Parker Mary A | $103,700 | -- | |
| Parker Mary A | -- | -- |
Source: Public Records
Mortgage History
| Date | Status | Borrower | Loan Amount |
|---|---|---|---|
| Closed | Mounts James W | $69,000 |
Source: Public Records
Tax History Compared to Growth
Tax History
| Year | Tax Paid | Tax Assessment Tax Assessment Total Assessment is a certain percentage of the fair market value that is determined by local assessors to be the total taxable value of land and additions on the property. | Land | Improvement |
|---|---|---|---|---|
| 2024 | $3,024 | $74,200 | $17,325 | $56,875 |
| 2023 | $3,386 | $63,250 | $16,350 | $46,900 |
| 2022 | $3,388 | $63,250 | $16,350 | $46,900 |
| 2021 | $3,361 | $63,250 | $16,350 | $46,900 |
| 2020 | $3,004 | $51,840 | $13,410 | $38,430 |
| 2019 | $2,916 | $148,100 | $38,300 | $109,800 |
| 2018 | $2,357 | $51,840 | $13,410 | $38,430 |
| 2017 | $2,555 | $47,260 | $10,190 | $37,070 |
| 2016 | $2,534 | $47,260 | $10,190 | $37,070 |
| 2015 | $2,637 | $47,260 | $10,190 | $37,070 |
| 2014 | $2,637 | $48,240 | $10,400 | $37,840 |
Source: Public Records
Map
Nearby Homes
- 19240 Briarwood Ln
- 11432 Pearl Rd
- 11499 Pearl Rd Unit A106
- 11179 Fawn Meadow Ln
- 10986 Fawn Meadow Ln
- 19890 Idlewood Trail
- 19997 Idlewood Trail
- 20050 Idlewood Trail
- 18336 Falling Water Rd
- 12385 Corinth Ct
- 12539 Olympus Way
- 11650 River Moss Rd
- 20424 Scotch Pine Way
- 12647 Edgepark Cir
- 12694 Ionia Ct
- 18248 Meadow Ln
- 17945 Cliffside Dr
- 13066 Olympus Way
- 13099 Olympus Way
- 13156 Olympus Way
- 11235 Co Moor Blvd
- 11253 Co Moor Blvd
- 11271 Co Moor Blvd
- 11289 Comoor Blvd
- 11289 Co Moor Blvd
- 11294 Co Moor Blvd
- 11307 Co Moor Blvd
- 11266 Co Moor Blvd
- 11325 Co Moor Blvd
- 11332 Co Moor Blvd
- 11220 Pearl Rd
- 11343 Co Moor Blvd
- 11306 Pearl Rd
- 19220 Briarwood Ln Unit 4
- 19234 Briarwood Ln
- 19226 Briarwood Ln
- 19234 Briarwood Ln Unit 1-2
- 19240 Briarwood Ln Unit 1-1
- 11180 Pearl Rd
- 11350 Co Moor Blvd