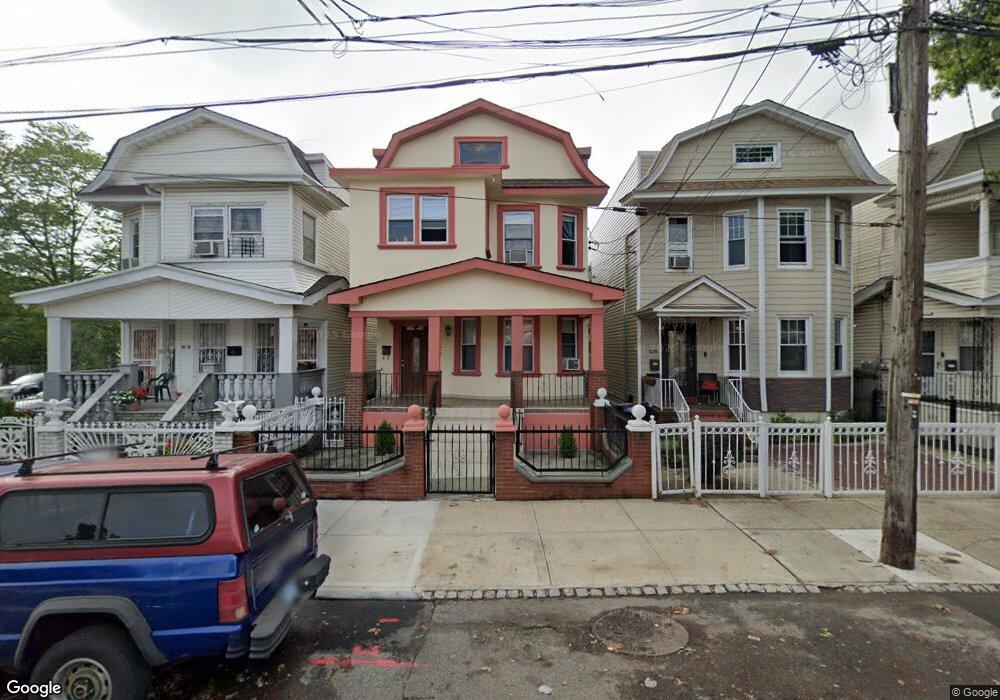
11218 95th Ave South Richmond Hill, NY 11419
Richmond Hill NeighborhoodEstimated Value: $794,000 - $1,198,000
--
Bed
--
Bath
3,129
Sq Ft
$316/Sq Ft
Est. Value
About This Home
This home is located at 11218 95th Ave, South Richmond Hill, NY 11419 and is currently estimated at $988,329, approximately $315 per square foot. 11218 95th Ave is a home located in Queens County with nearby schools including P.S. 62 - Chester Park, M.S.137 America's School of Heroes, and Richmond Hill High School.
Ownership History
Date
Name
Owned For
Owner Type
Purchase Details
Closed on
Mar 2, 2023
Sold by
Chavez-Pilozo Blanca
Bought by
Chavez Jayson and Chavez-Pilozo Blanca
Current Estimated Value
Purchase Details
Closed on
Jun 23, 2004
Sold by
Chavez Blanca and Chavez Manuel
Bought by
Chavez-Pilozo Blanca
Purchase Details
Closed on
Apr 13, 2000
Sold by
Orkiszewski Stanley and Orkiszewski June J
Bought by
Chavez Manuel and Chavez Blanca
Home Financials for this Owner
Home Financials are based on the most recent Mortgage that was taken out on this home.
Original Mortgage
$265,050
Outstanding Balance
$87,938
Interest Rate
8.21%
Mortgage Type
Purchase Money Mortgage
Estimated Equity
$900,391
Create a Home Valuation Report for This Property
The Home Valuation Report is an in-depth analysis detailing your home's value as well as a comparison with similar homes in the area
Home Values in the Area
Average Home Value in this Area
Purchase History
| Date | Buyer | Sale Price | Title Company |
|---|---|---|---|
| Chavez Jayson | -- | -- | |
| Chavez Jayson | -- | -- | |
| Chavez Jayson | -- | -- | |
| Chavez-Pilozo Blanca | -- | -- | |
| Chavez-Pilozo Blanca | -- | -- | |
| Chavez Manuel | $279,000 | Fidelity National Title Ins | |
| Chavez Manuel | $279,000 | Fidelity National Title Ins |
Source: Public Records
Mortgage History
| Date | Status | Borrower | Loan Amount |
|---|---|---|---|
| Open | Chavez Manuel | $265,050 | |
| Closed | Chavez Manuel | $265,050 | |
| Closed | Chavez-Pilozo Blanca | $0 |
Source: Public Records
Tax History Compared to Growth
Tax History
| Year | Tax Paid | Tax Assessment Tax Assessment Total Assessment is a certain percentage of the fair market value that is determined by local assessors to be the total taxable value of land and additions on the property. | Land | Improvement |
|---|---|---|---|---|
| 2025 | $7,426 | $39,161 | $11,732 | $27,429 |
| 2024 | $7,426 | $36,974 | $11,532 | $25,442 |
| 2023 | $7,081 | $35,254 | $9,427 | $25,827 |
| 2022 | $6,694 | $55,320 | $17,760 | $37,560 |
| 2021 | $7,057 | $49,680 | $17,760 | $31,920 |
| 2020 | $6,908 | $42,720 | $17,760 | $24,960 |
| 2019 | $6,446 | $36,600 | $17,760 | $18,840 |
| 2018 | $5,989 | $29,378 | $14,186 | $15,192 |
| 2017 | $5,697 | $27,945 | $11,919 | $16,026 |
| 2016 | $5,586 | $27,945 | $11,919 | $16,026 |
| 2015 | $3,180 | $27,195 | $15,724 | $11,471 |
| 2014 | $3,180 | $25,677 | $17,822 | $7,855 |
Source: Public Records
Map
Nearby Homes